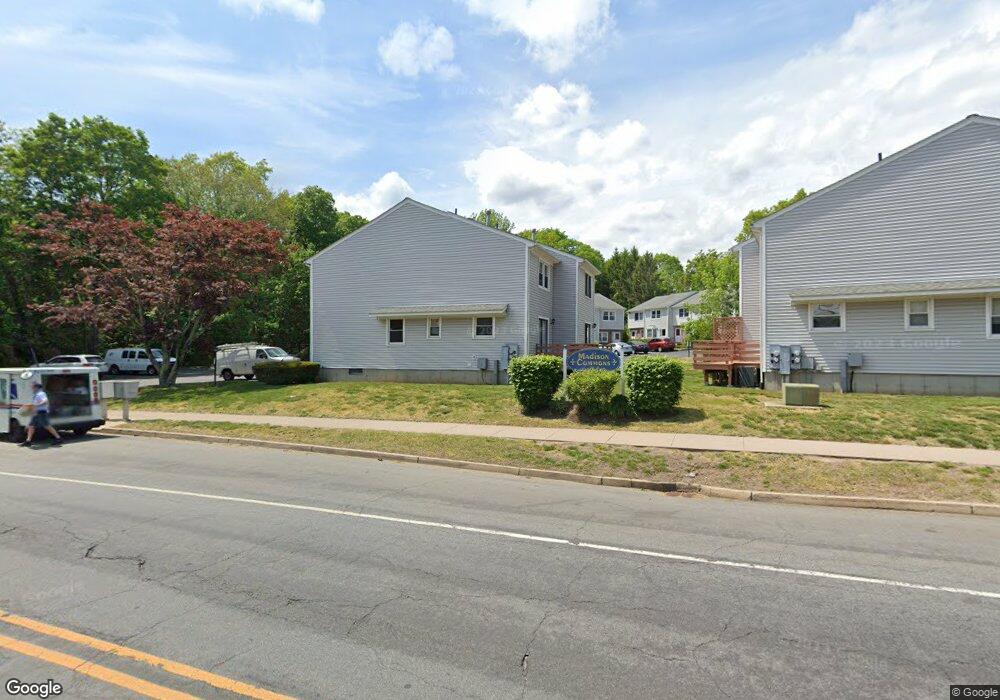
3225 Madison Ave Unit 16 Bridgeport, CT 06606
North End NeighborhoodEstimated Value: $260,000 - $301,000
2
Beds
2
Baths
1,140
Sq Ft
$243/Sq Ft
Est. Value
About This Home
This home is located at 3225 Madison Ave Unit 16, Bridgeport, CT 06606 and is currently estimated at $277,515, approximately $243 per square foot. 3225 Madison Ave Unit 16 is a home located in Fairfield County with nearby schools including John Winthrop School, Central High School, and St Andrew School.
Ownership History
Date
Name
Owned For
Owner Type
Purchase Details
Closed on
Jul 23, 2024
Sold by
Jones Lisa
Bought by
Mendoza Velissa Y
Current Estimated Value
Home Financials for this Owner
Home Financials are based on the most recent Mortgage that was taken out on this home.
Original Mortgage
$218,500
Outstanding Balance
$215,870
Interest Rate
6.95%
Mortgage Type
Purchase Money Mortgage
Estimated Equity
$61,645
Purchase Details
Closed on
Mar 5, 2024
Sold by
Ciofani Robert J
Bought by
Jones Lisa
Purchase Details
Closed on
Sep 14, 1994
Sold by
Diversified Coolidge
Bought by
Ciofani Anthony J and Ciofani Arlene
Home Financials for this Owner
Home Financials are based on the most recent Mortgage that was taken out on this home.
Original Mortgage
$49,910
Interest Rate
8.38%
Mortgage Type
Purchase Money Mortgage
Create a Home Valuation Report for This Property
The Home Valuation Report is an in-depth analysis detailing your home's value as well as a comparison with similar homes in the area
Home Values in the Area
Average Home Value in this Area
Purchase History
| Date | Buyer | Sale Price | Title Company |
|---|---|---|---|
| Mendoza Velissa Y | $230,000 | None Available | |
| Mendoza Velissa Y | $230,000 | None Available | |
| Mendoza Velissa Y | $230,000 | None Available | |
| Jones Lisa | -- | None Available | |
| Jones Lisa | -- | None Available | |
| Jones Lisa | -- | None Available | |
| Ciofani Anthony J | $49,900 | -- | |
| Ciofani Anthony J | $49,900 | -- |
Source: Public Records
Mortgage History
| Date | Status | Borrower | Loan Amount |
|---|---|---|---|
| Open | Mendoza Velissa Y | $218,500 | |
| Closed | Mendoza Velissa Y | $218,500 | |
| Previous Owner | Ciofani Anthony J | $49,910 |
Source: Public Records
Tax History Compared to Growth
Tax History
| Year | Tax Paid | Tax Assessment Tax Assessment Total Assessment is a certain percentage of the fair market value that is determined by local assessors to be the total taxable value of land and additions on the property. | Land | Improvement |
|---|---|---|---|---|
| 2025 | $4,540 | $104,480 | $0 | $104,480 |
| 2024 | $4,540 | $104,480 | $0 | $104,480 |
| 2023 | $4,540 | $104,480 | $0 | $104,480 |
| 2022 | $4,540 | $104,480 | $0 | $104,480 |
| 2021 | $4,540 | $104,480 | $0 | $104,480 |
| 2020 | $4,768 | $88,320 | $0 | $88,320 |
| 2019 | $4,768 | $88,320 | $0 | $88,320 |
| 2018 | $4,802 | $88,320 | $0 | $88,320 |
| 2017 | $4,802 | $88,320 | $0 | $88,320 |
| 2016 | $4,802 | $88,320 | $0 | $88,320 |
| 2015 | $6,168 | $146,150 | $0 | $146,150 |
| 2014 | $6,168 | $146,150 | $0 | $146,150 |
Source: Public Records
Map
Nearby Homes
- 236 Edgemoor Rd Unit D
- 9 Patricia Rd Unit C
- 2998 Madison Ave Unit C
- 2955 Madison Ave Unit 40
- 15 Cherry Hill Dr Unit 2A
- 230 Cherry Hill Dr Unit 2B
- 50 Greenhouse Rd Unit 65D
- 50 Greenhouse Rd Unit 42C
- 2800 Madison Ave Unit 1B
- 64 Dobson St
- 65 Dobson St
- 173 Anton Dr
- 72 Herald Ave
- 12 Riverview Dr Unit 12
- 17 Teresa Place Unit 17
- 394 Anton Dr
- 288 Sunrise Terrace
- 265 Vincellette St
- 153 Seaver Cir
- 333 Vincellette St Unit 109
- 3215 Madison Ave Unit 31
- 3215 Madison Ave Unit 30
- 3215 Madison Ave Unit 29
- 3205 Madison Ave Unit 28
- 3205 Madison Ave Unit 27
- 3205 Madison Ave Unit 25
- 3205 Madison Ave Unit 24
- 3205 Madison Ave Unit 23
- 3205 Madison Ave Unit 22
- 3205 Madison Ave Unit 21
- 3225 Madison Ave Unit 20
- 3225 Madison Ave Unit 19
- 3225 Madison Ave Unit 18
- 3225 Madison Ave Unit 17
- 3225 Madison Ave Unit 15
- 3225 Madison Ave Unit 14
- 3225 Madison Ave Unit 13
- 3205 Madison Ave
- 3255 Madison Ave Unit 7
- 3255 Madison Ave Unit 6