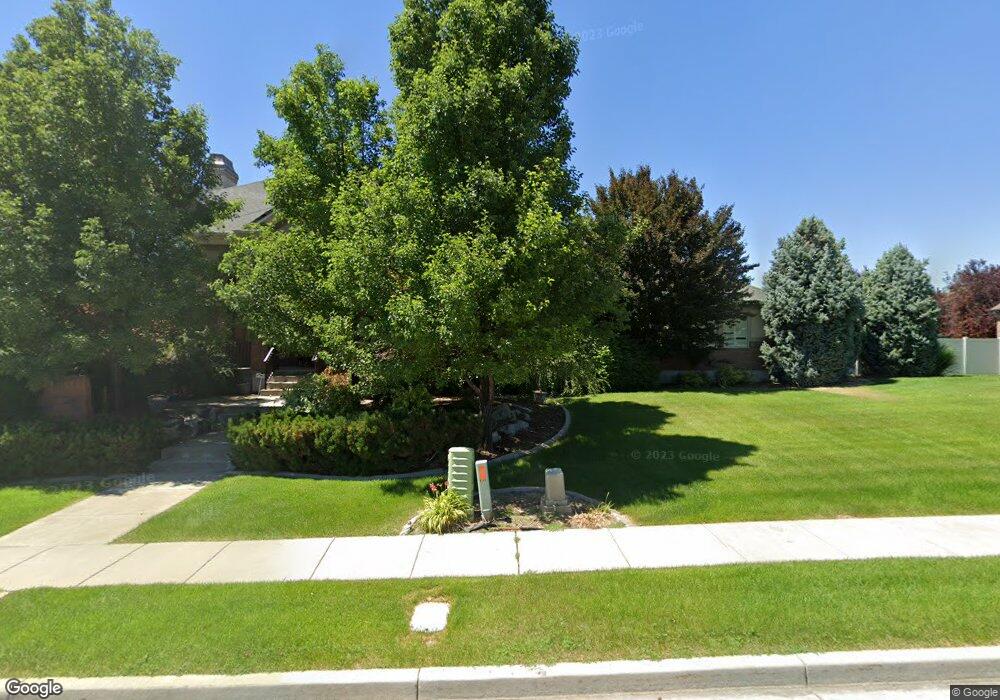
3225 N 1050 W Pleasant View, UT 84414
Estimated Value: $1,265,000 - $1,638,000
6
Beds
5
Baths
5,571
Sq Ft
$264/Sq Ft
Est. Value
About This Home
This home is located at 3225 N 1050 W, Pleasant View, UT 84414 and is currently estimated at $1,471,758, approximately $264 per square foot. 3225 N 1050 W is a home located in Weber County with nearby schools including Orion Junior High School, Weber High School, and Maria Montessori Academy.
Ownership History
Date
Name
Owned For
Owner Type
Purchase Details
Closed on
Oct 27, 2006
Sold by
Anderson Matt K and Anderson Sandra
Bought by
Anderson Matt K and Anderson Sandra D
Current Estimated Value
Home Financials for this Owner
Home Financials are based on the most recent Mortgage that was taken out on this home.
Original Mortgage
$336,000
Interest Rate
6.36%
Mortgage Type
New Conventional
Purchase Details
Closed on
Nov 22, 2005
Sold by
Anderson Matt and Anderson Sandy
Bought by
Anderson Matt K and Anderson Sandra
Home Financials for this Owner
Home Financials are based on the most recent Mortgage that was taken out on this home.
Original Mortgage
$570,515
Interest Rate
5.5%
Mortgage Type
Construction
Create a Home Valuation Report for This Property
The Home Valuation Report is an in-depth analysis detailing your home's value as well as a comparison with similar homes in the area
Home Values in the Area
Average Home Value in this Area
Purchase History
| Date | Buyer | Sale Price | Title Company |
|---|---|---|---|
| Anderson Matt K | -- | Mountain View Title | |
| Anderson Matt K | -- | First American Title |
Source: Public Records
Mortgage History
| Date | Status | Borrower | Loan Amount |
|---|---|---|---|
| Closed | Anderson Matt K | $336,000 | |
| Closed | Anderson Matt K | $570,515 |
Source: Public Records
Tax History
| Year | Tax Paid | Tax Assessment Tax Assessment Total Assessment is a certain percentage of the fair market value that is determined by local assessors to be the total taxable value of land and additions on the property. | Land | Improvement |
|---|---|---|---|---|
| 2025 | $10,262 | $1,681,235 | $236,620 | $1,444,615 |
| 2024 | $9,932 | $905,300 | $130,141 | $775,159 |
| 2023 | $8,640 | $787,050 | $127,383 | $659,667 |
| 2022 | $8,480 | $789,250 | $116,052 | $673,198 |
| 2021 | $7,840 | $1,239,000 | $144,540 | $1,094,460 |
| 2020 | $7,285 | $1,063,000 | $131,882 | $931,118 |
| 2019 | $7,375 | $1,029,000 | $126,877 | $902,123 |
| 2018 | $7,653 | $1,027,000 | $96,557 | $930,443 |
| 2017 | $6,743 | $852,000 | $96,557 | $755,443 |
| 2016 | $5,936 | $407,438 | $47,654 | $359,784 |
| 2015 | $5,946 | $406,019 | $50,775 | $355,244 |
| 2014 | $5,458 | $365,210 | $42,358 | $322,852 |
Source: Public Records
Map
Nearby Homes
- 1076 Mountain Orchard Dr
- 3352 N 1100 W
- 3414 N 1160 W Unit 214-R
- 1012 W 3550 N
- 0 W Pleasant View Dr
- 1379 W 3125 N
- 2750 N Parkland Blvd E Unit 16
- 789 W 3500 N
- 1616 W 3125 N Unit 7
- 1621 W 3125 N Unit 4
- 1629 W 3125 N
- 1629 W 3125 N Unit 5
- 993 W 3800 N
- 1026 W 3800 N
- 641 W Elberta Dr Unit 1
- 600 W 2700 N
- 3875 N 1000 W
- 731 W 3750 N
- 3252 N 600 W
- 3900 N 1000 W
- 3245 N 1050 W
- 3224 N 1050 W
- 3258 N 1050 W
- 1048 Mountain Orchard Dr
- 1048 W Mountain Orchard Dr
- 3249 Macintosh Way
- 3250 N 1075 W
- 3250 N 1075 W Unit 4
- 3228 N 1075 W
- 3266 N 1050 W
- 3206 N 1075 W
- 3204 N 1075 W
- 3255 Macintosh Way
- 1051 Mountain Orchard Dr
- 3211 Macintosh Way
- 1051 W Mountain Orchard Dr
- 3273 N 1050 W
- 3249 N 1075 W
- 3298 N 1075 W
- 3196 N 1075 W
Your Personal Tour Guide
Ask me questions while you tour the home.