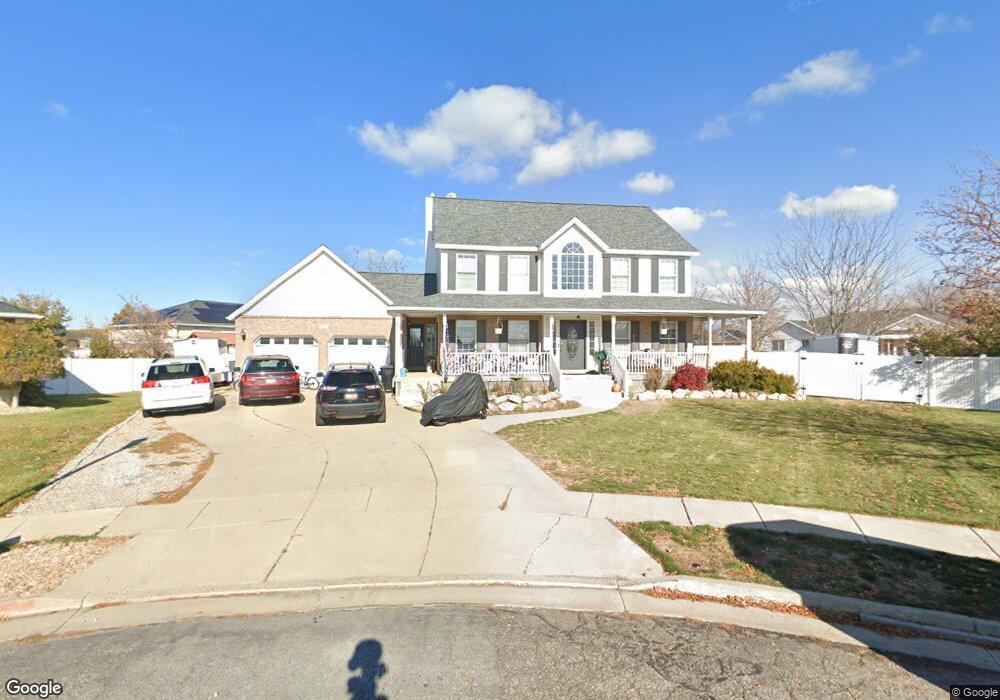
3225 S 865 W Syracuse, UT 84075
Estimated Value: $668,869 - $705,000
5
Beds
3
Baths
3,742
Sq Ft
$183/Sq Ft
Est. Value
About This Home
This home is located at 3225 S 865 W, Syracuse, UT 84075 and is currently estimated at $685,967, approximately $183 per square foot. 3225 S 865 W is a home located in Davis County with nearby schools including Bluff Ridge Elementary, Legacy Junior High School, and Clearfield High School.
Ownership History
Date
Name
Owned For
Owner Type
Purchase Details
Closed on
Feb 24, 2015
Sold by
Bobo James T
Bought by
Bobo James T and Bobo Tandy
Current Estimated Value
Purchase Details
Closed on
Dec 30, 2013
Sold by
Jones Brandon
Bought by
Jones Brandon and Jones Cassandra
Home Financials for this Owner
Home Financials are based on the most recent Mortgage that was taken out on this home.
Original Mortgage
$10,111
Interest Rate
4.17%
Mortgage Type
Stand Alone Second
Purchase Details
Closed on
Dec 27, 2013
Sold by
Heiner Scott R and Heiner Kathryn
Bought by
Jones Brandon
Home Financials for this Owner
Home Financials are based on the most recent Mortgage that was taken out on this home.
Original Mortgage
$10,111
Interest Rate
4.17%
Mortgage Type
Stand Alone Second
Create a Home Valuation Report for This Property
The Home Valuation Report is an in-depth analysis detailing your home's value as well as a comparison with similar homes in the area
Home Values in the Area
Average Home Value in this Area
Purchase History
| Date | Buyer | Sale Price | Title Company |
|---|---|---|---|
| Bobo James T | -- | American Secure Title | |
| Bobo James T | -- | First American Title | |
| Jones Brandon | -- | None Available | |
| Jones Brandon | -- | First American Title |
Source: Public Records
Mortgage History
| Date | Status | Borrower | Loan Amount |
|---|---|---|---|
| Previous Owner | Jones Brandon | $10,111 | |
| Previous Owner | Jones Brandon | $284,747 |
Source: Public Records
Tax History Compared to Growth
Tax History
| Year | Tax Paid | Tax Assessment Tax Assessment Total Assessment is a certain percentage of the fair market value that is determined by local assessors to be the total taxable value of land and additions on the property. | Land | Improvement |
|---|---|---|---|---|
| 2025 | $3,381 | $326,150 | $139,216 | $186,934 |
| 2024 | $3,211 | $311,850 | $123,249 | $188,601 |
| 2023 | $3,113 | $551,000 | $171,252 | $379,748 |
| 2022 | $3,492 | $338,800 | $97,438 | $241,362 |
| 2021 | $2,976 | $447,000 | $144,934 | $302,066 |
| 2020 | $2,675 | $389,000 | $122,144 | $266,856 |
| 2019 | $2,549 | $366,000 | $124,435 | $241,565 |
| 2018 | $2,386 | $340,000 | $117,442 | $222,558 |
| 2016 | $2,262 | $169,070 | $44,892 | $124,178 |
| 2015 | $2,305 | $164,010 | $44,892 | $119,118 |
| 2014 | $2,133 | $154,703 | $44,892 | $109,811 |
| 2013 | -- | $155,361 | $41,329 | $114,032 |
Source: Public Records
Map
Nearby Homes
- 967 W Yamada Ct
- 1139 W 3150 S
- 3169 S 550 W
- 803 W 2800 S
- 567 W 3575 S
- 454 N 3550 W
- 3528 S Finch St
- 2958 S 1320 W
- 2766 S 1200 W
- 3067 S Old Emigrant Rd Unit B
- 2784 S 1720 W Unit F
- 3637 S Creek Side Ln
- 3263 W 850 N
- 1137 W 2500 S
- 1546 W Parkview Dr
- 101 S 3600 W
- 697 N 3275 W
- 2480 S 1150 W
- 3074 S Edgewater Ln
- 475 W 2400 S