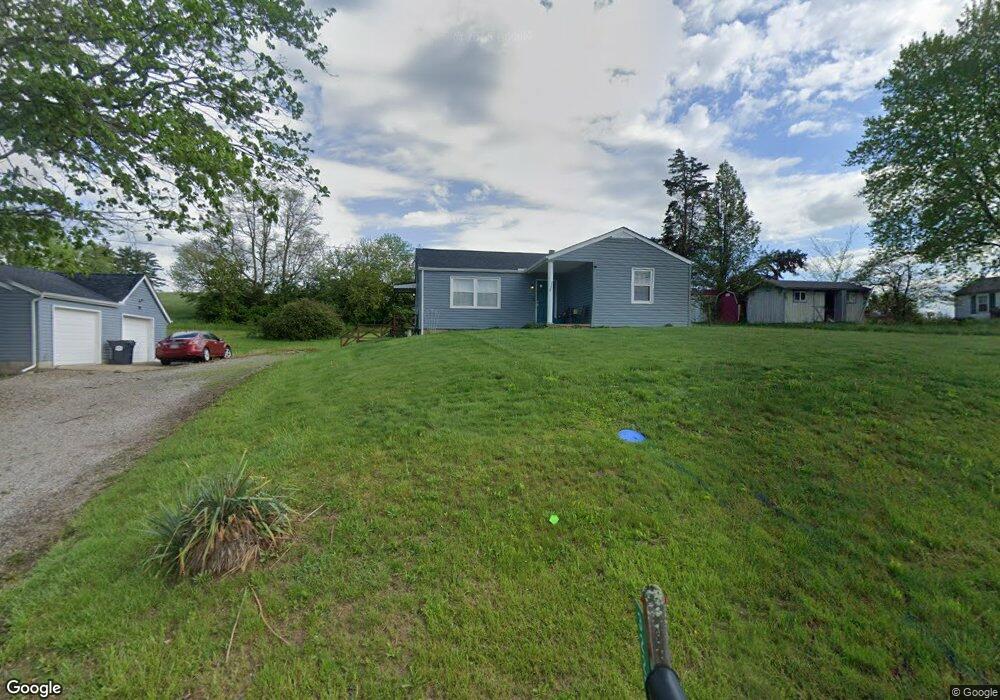
3225 S Pleasant Grove Rd Zanesville, OH 43701
Estimated Value: $223,000 - $279,000
3
Beds
1
Bath
1,032
Sq Ft
$246/Sq Ft
Est. Value
About This Home
This home is located at 3225 S Pleasant Grove Rd, Zanesville, OH 43701 and is currently estimated at $253,706, approximately $245 per square foot. 3225 S Pleasant Grove Rd is a home located in Muskingum County with nearby schools including National Road Elementary School, Zanesville Middle School, and Zanesville High School.
Ownership History
Date
Name
Owned For
Owner Type
Purchase Details
Closed on
Nov 3, 2020
Sold by
Bruce Tiffany A and Cash Tiffany A
Bought by
Heiney Heather D
Current Estimated Value
Home Financials for this Owner
Home Financials are based on the most recent Mortgage that was taken out on this home.
Original Mortgage
$128,250
Outstanding Balance
$114,329
Interest Rate
2.9%
Mortgage Type
New Conventional
Estimated Equity
$139,377
Purchase Details
Closed on
Jul 19, 2017
Sold by
Cash Adam
Bought by
Cash Tiffany A and Bruce Tiffany A
Purchase Details
Closed on
Oct 1, 2009
Sold by
Spragg Patricia A and Spragg David
Bought by
Cash Tiffany A
Home Financials for this Owner
Home Financials are based on the most recent Mortgage that was taken out on this home.
Original Mortgage
$89,000
Interest Rate
5.19%
Mortgage Type
New Conventional
Purchase Details
Closed on
Feb 13, 2004
Sold by
Orwig Evelyn G and Orwig Carl E
Bought by
Orwig Carl E and Spragg Patricia A
Create a Home Valuation Report for This Property
The Home Valuation Report is an in-depth analysis detailing your home's value as well as a comparison with similar homes in the area
Home Values in the Area
Average Home Value in this Area
Purchase History
| Date | Buyer | Sale Price | Title Company |
|---|---|---|---|
| Heiney Heather D | $135,000 | None Available | |
| Cash Tiffany A | -- | None Available | |
| Cash Tiffany A | $83,000 | Attorney | |
| Orwig Carl E | -- | -- |
Source: Public Records
Mortgage History
| Date | Status | Borrower | Loan Amount |
|---|---|---|---|
| Open | Heiney Heather D | $128,250 | |
| Previous Owner | Cash Tiffany A | $89,000 |
Source: Public Records
Tax History Compared to Growth
Tax History
| Year | Tax Paid | Tax Assessment Tax Assessment Total Assessment is a certain percentage of the fair market value that is determined by local assessors to be the total taxable value of land and additions on the property. | Land | Improvement |
|---|---|---|---|---|
| 2024 | $2,091 | $52,850 | $10,500 | $42,350 |
| 2023 | $1,732 | $40,670 | $6,440 | $34,230 |
| 2022 | $1,702 | $40,670 | $6,440 | $34,230 |
| 2021 | $1,688 | $40,670 | $6,440 | $34,230 |
| 2020 | $1,484 | $35,385 | $5,600 | $29,785 |
| 2019 | $1,483 | $35,385 | $5,600 | $29,785 |
| 2018 | $1,375 | $35,385 | $5,600 | $29,785 |
| 2017 | $1,327 | $30,765 | $5,600 | $25,165 |
| 2016 | $1,300 | $30,770 | $5,600 | $25,170 |
| 2015 | $1,300 | $30,770 | $5,600 | $25,170 |
| 2013 | $1,272 | $27,130 | $5,600 | $21,530 |
Source: Public Records
Map
Nearby Homes
- 240 Mockingbird Hill
- 2850 Watson Way
- 2425 S Pleasant Grove Rd
- 2465 Clay Pike
- 2870 Cody Dr
- 440 Stardust Cir
- 0 East Pike Unit 5163133
- 2755 N Lawndale Place
- 496 Pleasant Grove Rd
- 2383 Chandlersville Rd
- 2397 Adamsville Rd
- 2230 Adamsville Rd
- 1636 Sharon Ave
- 1605 Jackson Rd
- 365 Walters Way
- 360 Walters Way
- 330 Jordan Ave
- 4460 East Pike
- 1328 Pallas Ave
- 27 Cemetery Ave
- 3245 S Pleasant Grove Rd
- 3165 S Pleasant Grove Rd
- 3275 S Pleasant Grove Rd
- 3285 S Pleasant Grove Rd
- 3135 S Pleasant Grove Rd
- 480 S Pleasant Grove Cir
- 454 S Pleasant Grove Cir
- 495 S Pleasant Grove Cir
- 465/475 S Pleasant Grove Cir
- 465-475 S Pleasant Grove Cir
- 485 S Pleasant Grove Cir
- 3115 S Pleasant Grove Rd
- 450 S Pleasant Grove Cir
- 475 S Pleasant Grove Cir
- 465 S Pleasant Grove Cir
- 3155 S Pleasant Grove Rd
- 455 S Pleasant Grove Cir
- 455 S Pleasant Grove Cir
- 455 S Pleasant Grove Cir
- 455 S Pleasant Grove Cir