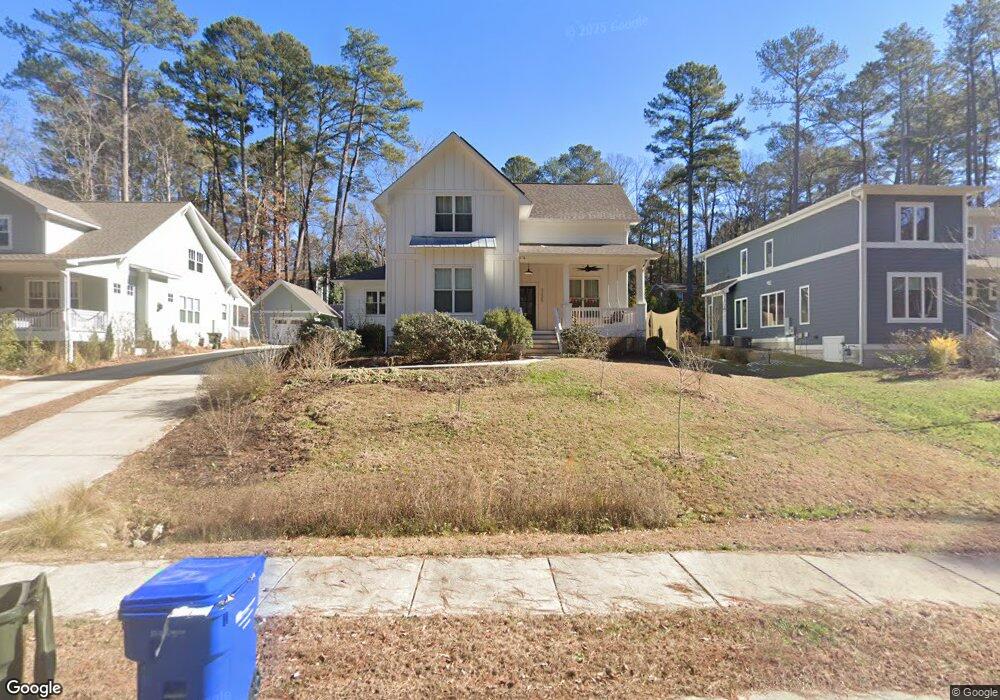
3225 Stanford Dr Durham, NC 27707
Hope Valley NeighborhoodEstimated Value: $623,210 - $822,000
About This Home
This home is located at 3225 Stanford Dr, Durham, NC 27707 and is currently estimated at $702,303, approximately $278 per square foot. 3225 Stanford Dr is a home located in Durham County with nearby schools including Morehead Montessori, Hope Valley Elementary, and Sherwood Githens Middle.
Ownership History
We collect this data history from publicly available records. To have your information removed, we recommend requesting removal directly through your county’s website.
Purchase Details
Purchase Details
Home Financials for this Owner
Home Financials are based on the most recent Mortgage that was taken out on this home.Purchase Details
Home Financials for this Owner
Home Financials are based on the most recent Mortgage that was taken out on this home.Home Values in the Area
Average Home Value in this Area
Purchase History
We collect this data history from publicly available records. To have your information removed, we recommend requesting removal directly through your county’s website.
| Date | Buyer | Sale Price | Title Company |
|---|---|---|---|
| $625,000 | None Available | ||
| $460,000 | None Available | ||
| $125,000 | None Available |
Mortgage History
We collect this data history from publicly available records. To have your information removed, we recommend requesting removal directly through your county’s website.
| Date | Status | Borrower | Loan Amount |
|---|---|---|---|
| Previous Owner | $413,600 | ||
| Previous Owner | $166,500 |
Tax History
We collect this data history from publicly available records. To have your information removed, we recommend requesting removal directly through your county’s website.
| Year | Tax Paid | Tax Assessment Tax Assessment Total Assessment is a certain percentage of the fair market value that is determined by local assessors to be the total taxable value of land and additions on the property. | Land | Improvement |
|---|---|---|---|---|
| 2025 | $6,026 | $607,851 | $173,250 | $434,601 |
| 2024 | $5,349 | $383,448 | $72,450 | $310,998 |
| 2023 | $5,023 | $383,218 | $72,220 | $310,998 |
| 2022 | $4,905 | $383,218 | $72,220 | $310,998 |
| 2021 | $4,882 | $387,093 | $72,220 | $314,873 |
| 2020 | $4,815 | $387,093 | $72,220 | $314,873 |
| 2019 | $4,815 | $387,093 | $72,220 | $314,873 |
| 2018 | $56 | $4,095 | $4,095 | $0 |
| 2017 | $55 | $4,095 | $4,095 | $0 |
| 2016 | $53 | $4,095 | $4,095 | $0 |
| 2015 | $40 | $2,873 | $2,873 | $0 |
| 2014 | -- | $2,873 | $2,873 | $0 |
Map
- 3116 Oxford Dr
- 2431 Alpine Rd
- 3107 Dixon Rd
- 2719 Bexley Ave
- 25 Saint Andrews Ct
- 3301 Lassiter St
- 2206 Alpine Rd
- 1311 Martin Luther King Junior Pkwy
- 13 Hartford Ct
- 502 Brookwood Dr
- 180 Montrose Dr
- 2944 Chapel Hill Rd
- 2940 Chapel Hill Rd Unit C
- 2940 Chapel Hill Rd Unit C+D
- 2940 Chapel Hill Rd Unit D
- 2938 Chapel Hill Rd Unit A
- 2207 N Oak Ridge Blvd
- 104 Archdale Dr
- 3306 Swansea St
- 2364 S Roxboro St
- 3229 Stanford Dr
- 3217 Stanford Dr
- 3237 Stanford Dr
- 3214 Oxford Dr
- 3213 Stanford Dr
- 3218 Oxford Dr
- 3212 Oxford Dr
- 3211 Stanford Dr
- 3210 Oxford Dr
- 3212 Stanford Dr
- 3209 Stanford Dr
- 3208 Oxford Dr
- 3210 Stanford Dr
- 3207 Stanford Dr
- 2502 Winton Rd
- 2510 Winton Rd
- 3208 Stanford Dr
- 3206 Oxford Dr
- 3219 Oxford Dr
- 3217 Oxford Dr
Ask me questions while you tour the home.