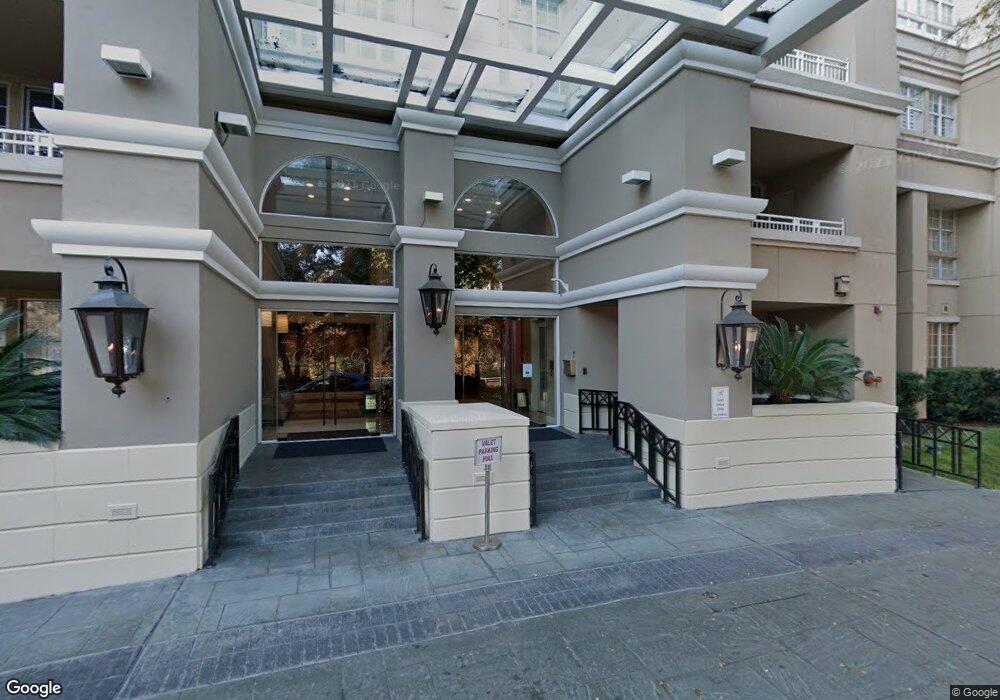
3225 Turtle Creek Blvd Unit 108B Dallas, TX 75219
Turtle Creek NeighborhoodEstimated Value: $396,362 - $448,000
2
Beds
2
Baths
1,163
Sq Ft
$360/Sq Ft
Est. Value
About This Home
This home is located at 3225 Turtle Creek Blvd Unit 108B, Dallas, TX 75219 and is currently estimated at $418,841, approximately $360 per square foot. 3225 Turtle Creek Blvd Unit 108B is a home located in Dallas County with nearby schools including Ben Milam Elementary School, Alex W. Spence Talented/Gifted Academy, and North Dallas High School.
Ownership History
Date
Name
Owned For
Owner Type
Purchase Details
Closed on
May 1, 2018
Sold by
Csn Family L P
Bought by
Lewis Kim Duke
Current Estimated Value
Purchase Details
Closed on
Jul 11, 2016
Sold by
Stanfield Lorea
Bought by
Csn Family Limited Partnership
Purchase Details
Closed on
Jan 5, 2016
Sold by
Hearn Justin
Bought by
Stanfield Lorea
Purchase Details
Closed on
Aug 18, 2008
Sold by
Scott Florea
Bought by
Hearn Justin
Purchase Details
Closed on
Apr 30, 2008
Sold by
Scott Florea
Bought by
Hearn Justin
Purchase Details
Closed on
Apr 18, 2007
Sold by
Turtle Creek Development Lp
Bought by
Scott Garvin L and Scott Florea J
Home Financials for this Owner
Home Financials are based on the most recent Mortgage that was taken out on this home.
Original Mortgage
$203,600
Interest Rate
6.15%
Mortgage Type
Purchase Money Mortgage
Create a Home Valuation Report for This Property
The Home Valuation Report is an in-depth analysis detailing your home's value as well as a comparison with similar homes in the area
Home Values in the Area
Average Home Value in this Area
Purchase History
| Date | Buyer | Sale Price | Title Company |
|---|---|---|---|
| Lewis Kim Duke | -- | Capital Title | |
| Csn Family Limited Partnership | -- | None Available | |
| Stanfield Lorea | -- | None Available | |
| Hearn Justin | -- | None Available | |
| Hearn Justin | -- | None Available | |
| Scott Garvin L | -- | Atc |
Source: Public Records
Mortgage History
| Date | Status | Borrower | Loan Amount |
|---|---|---|---|
| Previous Owner | Scott Garvin L | $203,600 |
Source: Public Records
Tax History Compared to Growth
Tax History
| Year | Tax Paid | Tax Assessment Tax Assessment Total Assessment is a certain percentage of the fair market value that is determined by local assessors to be the total taxable value of land and additions on the property. | Land | Improvement |
|---|---|---|---|---|
| 2025 | $7,954 | $412,870 | $39,300 | $373,570 |
| 2024 | $7,954 | $383,790 | $39,300 | $344,490 |
| 2023 | $7,954 | $296,570 | $36,390 | $260,180 |
| 2022 | $7,415 | $296,570 | $36,390 | $260,180 |
| 2021 | $7,823 | $296,570 | $36,390 | $260,180 |
| 2020 | $8,046 | $296,570 | $36,390 | $260,180 |
| 2019 | $8,603 | $302,380 | $36,390 | $265,990 |
| 2018 | $8,222 | $302,380 | $36,390 | $265,990 |
| 2017 | $7,084 | $260,510 | $29,110 | $231,400 |
| 2016 | $6,092 | $224,040 | $26,200 | $197,840 |
| 2015 | $5,011 | $224,040 | $26,060 | $197,980 |
| 2014 | $5,011 | $224,040 | $26,060 | $197,980 |
Source: Public Records
Map
Nearby Homes
- 3225 Turtle Creek Blvd Unit 320
- 3225 Turtle Creek Blvd Unit 1012
- 3225 Turtle Creek Blvd Unit 246
- 3225 Turtle Creek Blvd Unit 828
- 3225 Turtle Creek Blvd Unit 943
- 3225 Turtle Creek Blvd Unit 806
- 3225 Turtle Creek Blvd Unit 1009
- 3225 Turtle Creek Blvd Unit 1042
- 3225 Turtle Creek Blvd Unit 1607
- 3225 Turtle Creek Blvd Unit 705
- 3225 Turtle Creek Blvd Unit 640
- 3225 Turtle Creek Blvd Unit 926
- 3225 Turtle Creek Blvd Unit 122
- 3225 Turtle Creek Blvd Unit 1234
- 3225 Turtle Creek Blvd Unit 1706
- 3225 Turtle Creek Blvd Unit 1637
- 3225 Turtle Creek Blvd Unit 142
- 3225 Turtle Creek Blvd Unit 1545C
- 3225 Turtle Creek Blvd Unit 1505
- 3225 Turtle Creek Blvd Unit 1613
- 3225 Turtle Creek Blvd Unit 828B
- 3225 Turtle Creek Blvd Unit 514B
- 3225 Turtle Creek Blvd Unit 1135B
- 3225 Turtle Creek Blvd Unit 1211B
- 3225 Turtle Creek Blvd Unit 746B
- 3225 Turtle Creek Blvd Unit 620B
- 3225 Turtle Creek Blvd Unit 1540B
- 3225 Turtle Creek Blvd Unit 1655B
- 3225 Turtle Creek Blvd Unit 2106A
- 3225 Turtle Creek Blvd Unit 1114B
- 3225 Turtle Creek Blvd Unit 110B
- 3225 Turtle Creek Blvd Unit 1630B
- 3225 Turtle Creek Blvd Unit 1016B
- 3225 Turtle Creek Blvd Unit 1524B
- 3225 Turtle Creek Blvd Unit 1026B
- 3225 Turtle Creek Blvd Unit 1616B
- 3225 Turtle Creek Blvd Unit 638B
- 3225 Turtle Creek Blvd Unit 833B
- 3225 Turtle Creek Blvd Unit 540B
- 3225 Turtle Creek Blvd Unit 1428B