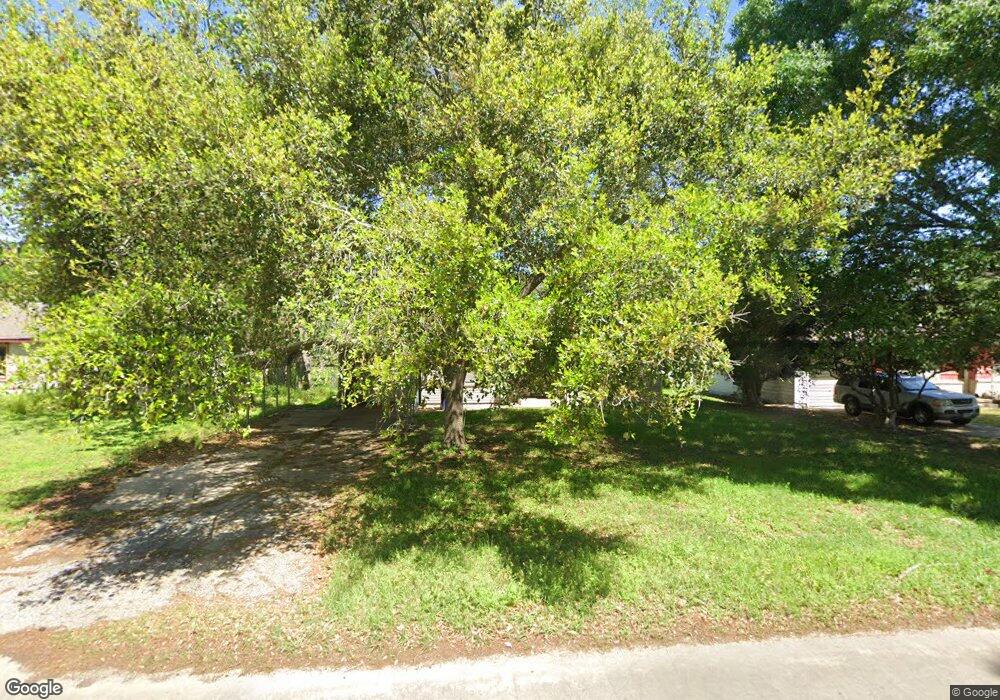
3227 12th St Bay City, TX 77414
Estimated Value: $158,000 - $179,000
2
Beds
2
Baths
1,407
Sq Ft
$118/Sq Ft
Est. Value
About This Home
This home is located at 3227 12th St, Bay City, TX 77414 and is currently estimated at $165,760, approximately $117 per square foot. 3227 12th St is a home located in Matagorda County with nearby schools including John H. Cherry Elementary School, Bay City Junior High School, and Bay City High School.
Ownership History
Date
Name
Owned For
Owner Type
Purchase Details
Closed on
Jul 31, 2019
Sold by
Gibson Charlsie Evelyn
Bought by
Allgeyer Andrew R
Current Estimated Value
Home Financials for this Owner
Home Financials are based on the most recent Mortgage that was taken out on this home.
Original Mortgage
$70,500
Outstanding Balance
$31,441
Interest Rate
3.8%
Mortgage Type
New Conventional
Estimated Equity
$134,319
Purchase Details
Closed on
Apr 25, 2014
Sold by
Christmas Margie Avanell
Bought by
Gibson Charlsie Evelyn
Create a Home Valuation Report for This Property
The Home Valuation Report is an in-depth analysis detailing your home's value as well as a comparison with similar homes in the area
Home Values in the Area
Average Home Value in this Area
Purchase History
| Date | Buyer | Sale Price | Title Company |
|---|---|---|---|
| Allgeyer Andrew R | -- | Bay City Abstract And Ttl Co | |
| Gibson Charlsie Evelyn | -- | None Available |
Source: Public Records
Mortgage History
| Date | Status | Borrower | Loan Amount |
|---|---|---|---|
| Open | Allgeyer Andrew R | $70,500 |
Source: Public Records
Tax History Compared to Growth
Tax History
| Year | Tax Paid | Tax Assessment Tax Assessment Total Assessment is a certain percentage of the fair market value that is determined by local assessors to be the total taxable value of land and additions on the property. | Land | Improvement |
|---|---|---|---|---|
| 2024 | $36 | $156,600 | $28,000 | $128,600 |
| 2023 | $3,402 | $146,010 | $21,420 | $124,590 |
| 2022 | $2,975 | $111,390 | $14,000 | $97,390 |
| 2021 | $3,266 | $111,160 | $10,150 | $101,010 |
| 2020 | $2,712 | $88,750 | $10,150 | $78,600 |
| 2019 | $2,768 | $90,630 | $10,150 | $80,480 |
| 2018 | $2,762 | $93,770 | $10,150 | $83,620 |
| 2017 | $2,598 | $95,010 | $10,150 | $84,860 |
| 2016 | $2,362 | $86,250 | $10,150 | $76,100 |
| 2015 | -- | $76,910 | $10,150 | $66,760 |
| 2014 | -- | $37,700 | $5,075 | $32,625 |
Source: Public Records
Map
Nearby Homes