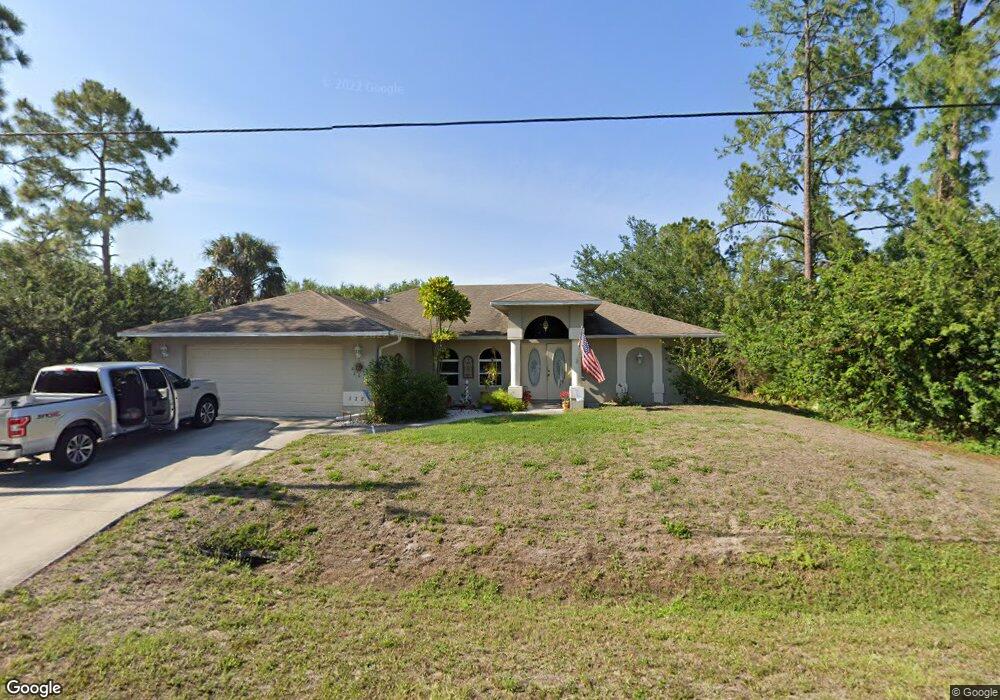
3228 31st St W Unit 1 Lehigh Acres, FL 33971
Richmond NeighborhoodEstimated Value: $283,119 - $365,000
3
Beds
2
Baths
1,992
Sq Ft
$156/Sq Ft
Est. Value
About This Home
This home is located at 3228 31st St W Unit 1, Lehigh Acres, FL 33971 and is currently estimated at $310,780, approximately $156 per square foot. 3228 31st St W Unit 1 is a home located in Lee County with nearby schools including Lehigh Elementary School, Gateway Elementary School, and The Alva School.
Ownership History
Date
Name
Owned For
Owner Type
Purchase Details
Closed on
Aug 24, 2011
Sold by
Rapid Rescue & Remodeling Llc
Bought by
Lessig Susan
Current Estimated Value
Home Financials for this Owner
Home Financials are based on the most recent Mortgage that was taken out on this home.
Original Mortgage
$64,559
Outstanding Balance
$45,073
Interest Rate
4.75%
Mortgage Type
FHA
Estimated Equity
$265,707
Purchase Details
Closed on
May 6, 2011
Sold by
Jurich Emily E
Bought by
Rapid Rescue & Remodeling Llc
Purchase Details
Closed on
Dec 31, 2004
Sold by
Samadnejad David
Bought by
Jurich Emily E
Home Financials for this Owner
Home Financials are based on the most recent Mortgage that was taken out on this home.
Original Mortgage
$159,900
Interest Rate
5.61%
Mortgage Type
Unknown
Purchase Details
Closed on
Jun 13, 2003
Sold by
Eberenz John M
Bought by
Smadnejad Davie
Create a Home Valuation Report for This Property
The Home Valuation Report is an in-depth analysis detailing your home's value as well as a comparison with similar homes in the area
Home Values in the Area
Average Home Value in this Area
Purchase History
| Date | Buyer | Sale Price | Title Company |
|---|---|---|---|
| Lessig Susan | $79,900 | Security Title & Abstract Ll | |
| Rapid Rescue & Remodeling Llc | $29,900 | Security Title & Abstract Ll | |
| Jurich Emily E | $199,900 | -- | |
| Smadnejad Davie | $4,000 | -- |
Source: Public Records
Mortgage History
| Date | Status | Borrower | Loan Amount |
|---|---|---|---|
| Open | Lessig Susan | $64,559 | |
| Previous Owner | Jurich Emily E | $159,900 |
Source: Public Records
Tax History Compared to Growth
Tax History
| Year | Tax Paid | Tax Assessment Tax Assessment Total Assessment is a certain percentage of the fair market value that is determined by local assessors to be the total taxable value of land and additions on the property. | Land | Improvement |
|---|---|---|---|---|
| 2025 | $1,241 | $82,175 | -- | -- |
| 2024 | $1,241 | $79,859 | -- | -- |
| 2023 | $1,241 | $77,533 | $0 | $0 |
| 2022 | $1,128 | $75,275 | $0 | $0 |
| 2021 | $1,054 | $158,946 | $5,800 | $153,146 |
| 2020 | $1,048 | $72,074 | $0 | $0 |
| 2019 | $1,079 | $70,454 | $0 | $0 |
| 2018 | $1,056 | $69,140 | $0 | $0 |
| 2017 | $1,022 | $67,718 | $0 | $0 |
| 2016 | $996 | $107,268 | $4,200 | $103,068 |
| 2015 | $990 | $91,111 | $4,000 | $87,111 |
| 2014 | $880 | $83,502 | $2,715 | $80,787 |
| 2013 | -- | $72,091 | $2,100 | $69,991 |
Source: Public Records
Map
Nearby Homes
- 3216 31st St W
- 3310 31st St W
- 2816 31st St W
- 3210 31st St W Unit 1
- 3014 29th St W
- 3004 Nadine Ln
- 3405 29th St W Unit 22
- 3405 29th St W
- 3402 30th St W
- 2800 30th St W
- 3110 33rd St W
- 3019 32nd St W
- 3175 Sunshine Blvd N
- 3315 Sunshine Blvd N
- 3203 Sunshine Blvd N
- 5405 Sunshine Blvd N
- 3113 Sunshine Blvd N
- 2633 Queen Dr
- 3214 34th St W
- 7503 Rita Ave N
- 3226 31st St W
- 3224 31st St W Unit 1
- 3227 31st St W
- 3222 31st St W
- 3225 31st St W
- 3104 Best Ct
- 3221 31st St W
- 3236 31st St W
- 3222 30th St W
- 3420 31st St W
- 3107 Sunshine Blvd
- 3304 31st St W
- 3105 Best Ct
- 3311 31st St W
- 3109 Sunshine Blvd
- 3216 31st St W
- 3218 30th St W
- 3306 31st St W
- 3225 30th St W Unit 1
- 3003 Nadine Ln