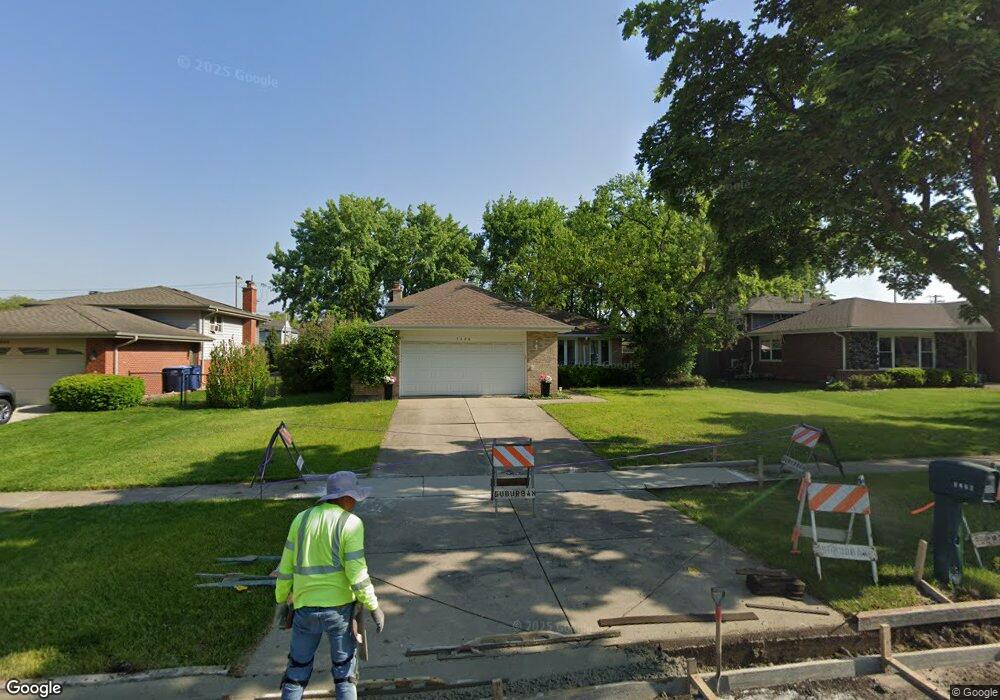
3228 Brewer Rd Darien, IL 60561
South Woodridge NeighborhoodEstimated Value: $406,987 - $475,000
3
Beds
2
Baths
1,110
Sq Ft
$402/Sq Ft
Est. Value
About This Home
This home is located at 3228 Brewer Rd, Darien, IL 60561 and is currently estimated at $446,497, approximately $402 per square foot. 3228 Brewer Rd is a home located in DuPage County with nearby schools including Prairieview Elementary School, Elizabeth Ide Elementary School, and Lakeview Jr High School.
Ownership History
Date
Name
Owned For
Owner Type
Purchase Details
Closed on
Dec 5, 2020
Sold by
Zelenka William B
Bought by
Zelenka William B and William Brooks Zelenka Living
Current Estimated Value
Purchase Details
Closed on
Jan 2, 2008
Sold by
Bischman Robert G and Bischman Diane M
Bought by
Zelenka William B
Home Financials for this Owner
Home Financials are based on the most recent Mortgage that was taken out on this home.
Original Mortgage
$232,000
Outstanding Balance
$144,833
Interest Rate
5.95%
Mortgage Type
Purchase Money Mortgage
Estimated Equity
$301,664
Purchase Details
Closed on
Feb 20, 1998
Sold by
Latanski Thomas J and Latanski Marcia Stoll
Bought by
Bischman Robert G and Bischman Diane M
Home Financials for this Owner
Home Financials are based on the most recent Mortgage that was taken out on this home.
Original Mortgage
$100,000
Interest Rate
7.08%
Create a Home Valuation Report for This Property
The Home Valuation Report is an in-depth analysis detailing your home's value as well as a comparison with similar homes in the area
Home Values in the Area
Average Home Value in this Area
Purchase History
| Date | Buyer | Sale Price | Title Company |
|---|---|---|---|
| Zelenka William B | -- | Attorney | |
| Zelenka William B | $290,000 | First American Title | |
| Bischman Robert G | $193,333 | -- |
Source: Public Records
Mortgage History
| Date | Status | Borrower | Loan Amount |
|---|---|---|---|
| Open | Zelenka William B | $232,000 | |
| Previous Owner | Bischman Robert G | $100,000 |
Source: Public Records
Tax History Compared to Growth
Tax History
| Year | Tax Paid | Tax Assessment Tax Assessment Total Assessment is a certain percentage of the fair market value that is determined by local assessors to be the total taxable value of land and additions on the property. | Land | Improvement |
|---|---|---|---|---|
| 2024 | $6,407 | $111,794 | $55,228 | $56,566 |
| 2023 | $6,138 | $102,770 | $50,770 | $52,000 |
| 2022 | $5,708 | $95,110 | $48,310 | $46,800 |
| 2021 | $5,241 | $94,030 | $47,760 | $46,270 |
| 2020 | $5,148 | $92,160 | $46,810 | $45,350 |
| 2019 | $4,975 | $88,420 | $44,910 | $43,510 |
| 2018 | $5,019 | $87,530 | $44,500 | $43,030 |
| 2017 | $4,839 | $84,230 | $42,820 | $41,410 |
| 2016 | $5,215 | $90,270 | $40,870 | $49,400 |
| 2015 | $5,130 | $84,930 | $38,450 | $46,480 |
| 2014 | $5,034 | $82,570 | $37,380 | $45,190 |
| 2013 | $5,094 | $82,180 | $37,200 | $44,980 |
Source: Public Records
Map
Nearby Homes
- 8269 Meadowwood Ave
- 1807 Nottingham Rd
- 1340 83rd St
- 8498 Cornelia Ln
- 8547 Harvest Ln
- Danbury II Plan at The Townes at Farmingdale
- Brighton Plan at The Townes at Farmingdale
- Braeden Plan at The Townes at Farmingdale
- Campbell Plan at The Townes at Farmingdale
- 8497 Liberty Ln
- 8539 Sperry Ct
- 8543 Sperry Ct
- 3145 Hillside Ln
- 8551 Sperry Ct
- 1858 Fulton St
- 1850 Fulton St
- 1846 Fulton St
- 8538 Sperry Ct
- 8537 Chadwick Ct
- 8530 Sperry Ct
- 3240 Brewer Rd
- 3216 Brewer Rd
- 3252 Brewer Rd
- 3204 Brewer Rd
- 20W130 83rd St
- 3229 Brewer Rd
- 3241 Brewer Rd
- 3217 Brewer Rd
- 3192 Brewer Rd
- 3253 Brewer Rd
- 3207 Brewer Rd
- 3265 Brewer Rd
- 3276 Brewer Rd
- 8292 Mulberry Dr
- 8288 Mulberry Dr
- 8336 Grandview Ln
- 3228 Drover Ln
- 3216 Drover Ln
- 32404 Drover Ln
- 3204 Drover Ln