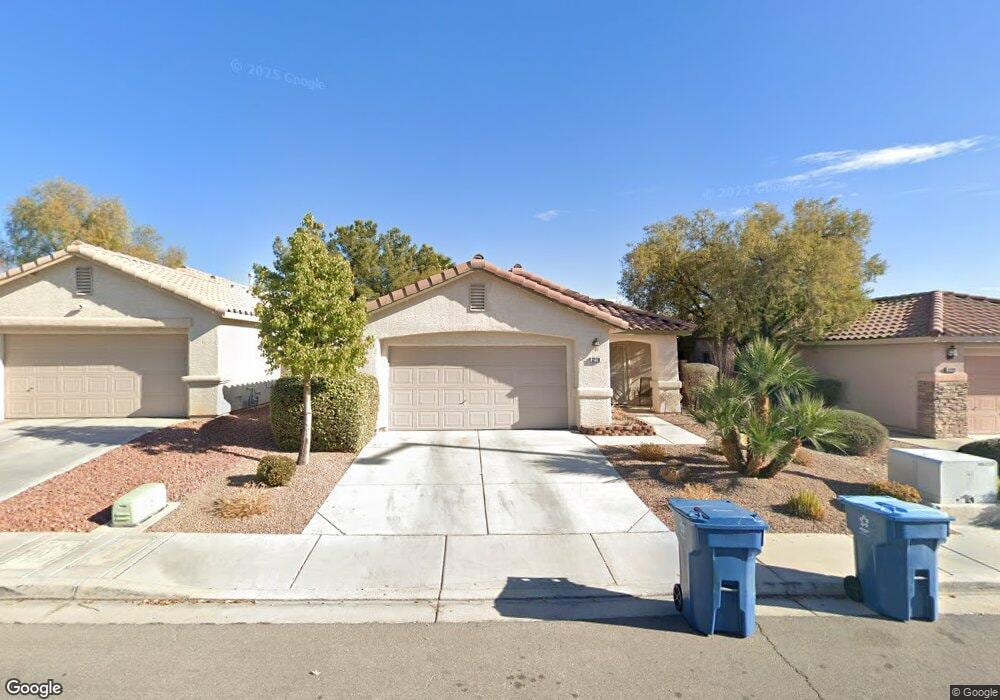
3228 Little Stream St Las Vegas, NV 89135
South Summerlin NeighborhoodEstimated Value: $441,225 - $475,000
3
Beds
2
Baths
1,284
Sq Ft
$358/Sq Ft
Est. Value
About This Home
This home is located at 3228 Little Stream St, Las Vegas, NV 89135 and is currently estimated at $460,056, approximately $358 per square foot. 3228 Little Stream St is a home located in Clark County with nearby schools including D'Vorre & Hal Ober Elementary School, Victoria Fertitta Middle School, and Palo Verde High School.
Ownership History
Date
Name
Owned For
Owner Type
Purchase Details
Closed on
May 17, 2011
Sold by
Fannie Mae
Bought by
Wilcox Teresa and Gallant Tracie
Current Estimated Value
Purchase Details
Closed on
Jan 31, 2011
Sold by
James F Peter and James Kristen
Bought by
Fannie Mae and Federal National Mortgage Association
Purchase Details
Closed on
Aug 6, 2007
Sold by
James F Peter and James Kristen
Bought by
James F Peter and James Kristen
Home Financials for this Owner
Home Financials are based on the most recent Mortgage that was taken out on this home.
Original Mortgage
$224,000
Interest Rate
6.65%
Mortgage Type
New Conventional
Purchase Details
Closed on
Apr 14, 1999
Sold by
Kaufman & Broad Of Nevada Inc
Bought by
James F Peter and James Kristen N
Home Financials for this Owner
Home Financials are based on the most recent Mortgage that was taken out on this home.
Original Mortgage
$127,024
Interest Rate
6.86%
Mortgage Type
FHA
Create a Home Valuation Report for This Property
The Home Valuation Report is an in-depth analysis detailing your home's value as well as a comparison with similar homes in the area
Home Values in the Area
Average Home Value in this Area
Purchase History
| Date | Buyer | Sale Price | Title Company |
|---|---|---|---|
| Wilcox Teresa | $127,000 | Lawyers Title Of Nevada Hen | |
| Fannie Mae | $236,476 | Accommodation | |
| James F Peter | -- | First Amer Title Co Of Nv | |
| James F Peter | $128,000 | United Title |
Source: Public Records
Mortgage History
| Date | Status | Borrower | Loan Amount |
|---|---|---|---|
| Previous Owner | James F Peter | $224,000 | |
| Previous Owner | James F Peter | $127,024 |
Source: Public Records
Tax History Compared to Growth
Tax History
| Year | Tax Paid | Tax Assessment Tax Assessment Total Assessment is a certain percentage of the fair market value that is determined by local assessors to be the total taxable value of land and additions on the property. | Land | Improvement |
|---|---|---|---|---|
| 2025 | $1,731 | $99,133 | $45,150 | $53,983 |
| 2024 | $1,681 | $99,133 | $45,150 | $53,983 |
| 2023 | $1,681 | $83,954 | $32,900 | $51,054 |
| 2022 | $1,632 | $74,123 | $27,300 | $46,823 |
| 2021 | $1,583 | $71,650 | $27,300 | $44,350 |
| 2020 | $1,534 | $68,214 | $24,150 | $44,064 |
| 2019 | $1,489 | $64,887 | $21,350 | $43,537 |
| 2018 | $1,446 | $60,696 | $18,900 | $41,796 |
| 2017 | $1,746 | $59,340 | $17,150 | $42,190 |
| 2016 | $1,370 | $55,552 | $13,300 | $42,252 |
| 2015 | $1,366 | $51,887 | $10,150 | $41,737 |
| 2014 | $1,326 | $44,288 | $7,350 | $36,938 |
Source: Public Records
Map
Nearby Homes
- 10555 Garden Rose Dr
- Luminary Plan at The Peaks - The Pointe at Ascension
- Royalty Plan at The Peaks - The Pointe at Ascension
- Kingsgate Plan at The Peaks - The Pointe at Ascension
- Dignitary Plan at The Peaks - The Pointe at Ascension
- 10591 Garden Rose Dr
- 10685 Refectory Ave
- 3203 Stratford Hall Ct
- 10457 Abbotsbury Dr
- 10717 Refectory Ave
- 10671 Capesthorne Way
- 10341 Early Morning Ave
- 10557 Garden Light Dr Unit 2
- 10267 Early Morning Ave
- 10281 Rarity Ave
- 10829 Ickworth Ct
- 3010 Hammerwood Dr
- 10799 Flame Vine Ct
- 10032 Fox Springs Dr
- 3212 Wisteria Tree St
- 3224 Little Stream St
- 3232 Little Stream St
- 3220 Little Stream St
- 3236 Little Stream St
- 3223 Velvet Rose St
- 3240 Little Stream St
- 3227 Velvet Rose St
- 3216 Little Stream St
- 3231 Velvet Rose St
- 3229 Little Stream St
- 3225 Little Stream St
- 3211 Velvet Rose St
- 3233 Little Stream St Unit non
- 3233 Little Stream St
- 3221 Little Stream St
- 3235 Velvet Rose St
- 3244 Little Stream St
- 3237 Little Stream St
- 3217 Little Stream St
- 3239 Velvet Rose St