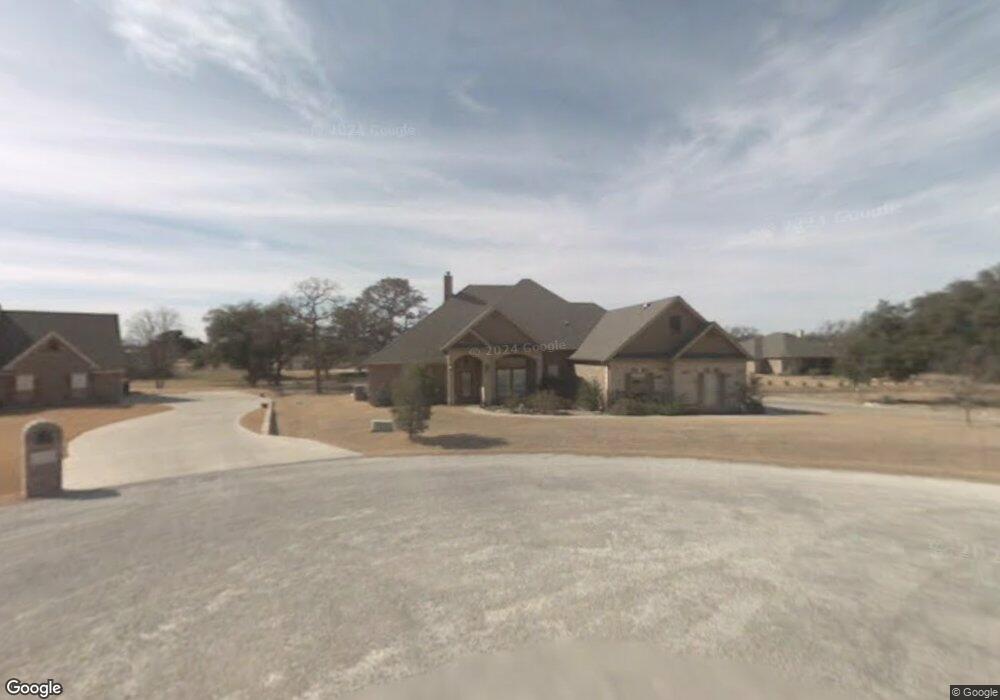
3229 Golden Oaks Cir Granbury, TX 76049
Estimated Value: $563,000 - $619,000
4
Beds
4
Baths
2,909
Sq Ft
$205/Sq Ft
Est. Value
About This Home
This home is located at 3229 Golden Oaks Cir, Granbury, TX 76049 and is currently estimated at $597,483, approximately $205 per square foot. 3229 Golden Oaks Cir is a home located in Hood County with nearby schools including Acton Elementary School, Acton Middle School, and Granbury High School.
Ownership History
Date
Name
Owned For
Owner Type
Purchase Details
Closed on
Jun 20, 2014
Sold by
Marsh Ernie and Marsh Debbie
Bought by
Peterson Thomas A and Peterson Kelley D
Current Estimated Value
Home Financials for this Owner
Home Financials are based on the most recent Mortgage that was taken out on this home.
Original Mortgage
$249,375
Outstanding Balance
$190,178
Interest Rate
4.27%
Mortgage Type
New Conventional
Estimated Equity
$407,305
Purchase Details
Closed on
Mar 5, 2010
Sold by
Kertz Mark G and Kertz Yvette A
Bought by
Marsh Ernest and Marsh Debbie
Purchase Details
Closed on
Aug 30, 2004
Sold by
Professional Transport & Installation
Bought by
Peterson Thomas A and Peterson Kelly D
Purchase Details
Closed on
Mar 10, 2004
Sold by
Marley Investments Llp
Bought by
Peterson Thomas A and Peterson Kelly D
Purchase Details
Closed on
May 10, 2000
Bought by
Peterson Thomas A and Peterson Kelly D
Create a Home Valuation Report for This Property
The Home Valuation Report is an in-depth analysis detailing your home's value as well as a comparison with similar homes in the area
Home Values in the Area
Average Home Value in this Area
Purchase History
| Date | Buyer | Sale Price | Title Company |
|---|---|---|---|
| Peterson Thomas A | -- | Central Texas Title | |
| Marsh Ernest | -- | None Available | |
| Peterson Thomas A | -- | -- | |
| Peterson Thomas A | -- | -- | |
| Peterson Thomas A | -- | -- |
Source: Public Records
Mortgage History
| Date | Status | Borrower | Loan Amount |
|---|---|---|---|
| Open | Peterson Thomas A | $249,375 |
Source: Public Records
Tax History Compared to Growth
Tax History
| Year | Tax Paid | Tax Assessment Tax Assessment Total Assessment is a certain percentage of the fair market value that is determined by local assessors to be the total taxable value of land and additions on the property. | Land | Improvement |
|---|---|---|---|---|
| 2025 | $5,377 | $547,019 | $45,000 | $537,880 |
| 2024 | $4,995 | $497,290 | $45,000 | $452,290 |
| 2023 | $5,701 | $508,160 | $45,000 | $463,160 |
| 2022 | $5,267 | $490,870 | $30,000 | $460,870 |
| 2021 | $5,944 | $392,100 | $30,000 | $362,100 |
| 2020 | $5,467 | $352,010 | $22,500 | $329,510 |
| 2019 | $5,474 | $336,720 | $22,500 | $314,220 |
| 2018 | $4,833 | $297,270 | $30,000 | $267,270 |
| 2017 | $4,853 | $290,190 | $30,000 | $260,190 |
| 2016 | $4,572 | $273,380 | $30,000 | $243,380 |
| 2015 | $4,504 | $271,840 | $30,000 | $241,840 |
| 2014 | $4,504 | $271,840 | $30,000 | $241,840 |
Source: Public Records
Map
Nearby Homes
- 3207 Hummingbird Ct
- 3218 Fountain Way
- 2925 Willow Ridge Cir
- 3119 Bob White Dr
- 4512 Cimmaron Trail
- 4920 Centre Ct
- 3707 Bob White Dr
- 2936 Willow Ridge Cir
- 2445 Bob White Dr
- 4312 Rhea Rd
- 3510 Fountain Way
- 4410 Halo Ct
- 3609 Upper Lake Cir
- 1141 Avery Rd
- 1144 Avery Rd
- 1136 Avery Rd
- 2918 James Rd
- 3606 Upper Lake Cir
- 5003 Bueno Dr
- 4012 Upper Lake Cir
- 4601 Stoney Creek Ct
- 3231 Golden Oaks Cir
- 3225 Golden Oaks Cir
- 3223 Golden Oaks Cir
- 3233 Golden Oaks Cir
- 4605 Stoney Creek Ct
- 3226 Golden Oaks Cir
- 4600 Stoney Creek Ct
- 3221 Golden Oaks Cir
- 4602 Stoney Creek Ct
- 4607 Stoney Creek Ct
- 4604 Stoney Creek Ct
- 3235 Golden Oaks Cir
- 3219 Golden Oaks Cir
- 3218 Golden Oaks Cir
- 3234 Golden Oaks Cir
- 4606 Stoney Creek Ct
- 3237 Golden Oaks Cir
- 3217 Golden Oaks Cir
- 4611 Stoney Creek Ct