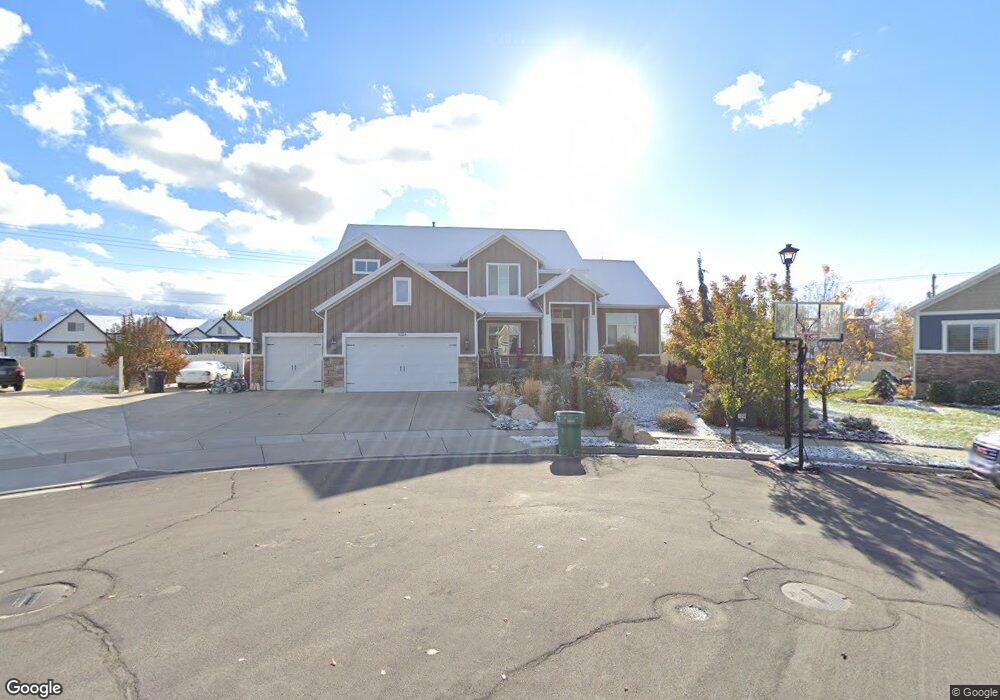
3229 W 25 N Unit 104 Layton, UT 84041
Estimated Value: $803,000 - $1,000,000
7
Beds
4
Baths
3,168
Sq Ft
$289/Sq Ft
Est. Value
About This Home
This home is located at 3229 W 25 N Unit 104, Layton, UT 84041 and is currently estimated at $916,614, approximately $289 per square foot. 3229 W 25 N Unit 104 is a home located in Davis County with nearby schools including Sand Springs Elementary School, Legacy Junior High School, and Layton High School.
Ownership History
Date
Name
Owned For
Owner Type
Purchase Details
Closed on
Oct 1, 2021
Sold by
Sorensen Andrea J
Bought by
Sorensen Shawn H
Current Estimated Value
Purchase Details
Closed on
Jan 18, 2018
Sold by
Bradley Clinton M
Bought by
Sorensen Shawn H and Sorensen Andrea J
Home Financials for this Owner
Home Financials are based on the most recent Mortgage that was taken out on this home.
Original Mortgage
$333,000
Outstanding Balance
$281,012
Interest Rate
3.94%
Mortgage Type
New Conventional
Estimated Equity
$635,602
Purchase Details
Closed on
Jan 11, 2010
Sold by
Johnson Dana and Johnson Cheryl
Bought by
Stockberger Travis and Stockberger Lisa
Home Financials for this Owner
Home Financials are based on the most recent Mortgage that was taken out on this home.
Original Mortgage
$335,000
Interest Rate
4.77%
Mortgage Type
Purchase Money Mortgage
Purchase Details
Closed on
Jul 29, 2009
Sold by
Jmr Holdings Llc
Bought by
Johnson Dana and Johnson Cheryl
Create a Home Valuation Report for This Property
The Home Valuation Report is an in-depth analysis detailing your home's value as well as a comparison with similar homes in the area
Home Values in the Area
Average Home Value in this Area
Purchase History
| Date | Buyer | Sale Price | Title Company |
|---|---|---|---|
| Sorensen Shawn H | -- | None Available | |
| Sorensen Shawn H | -- | Us Title | |
| Stockberger Travis | -- | Bonneville Superior Ti | |
| Johnson Dana | -- | Bonneville Superior Title Co |
Source: Public Records
Mortgage History
| Date | Status | Borrower | Loan Amount |
|---|---|---|---|
| Open | Sorensen Shawn H | $333,000 | |
| Previous Owner | Stockberger Travis | $335,000 |
Source: Public Records
Tax History Compared to Growth
Tax History
| Year | Tax Paid | Tax Assessment Tax Assessment Total Assessment is a certain percentage of the fair market value that is determined by local assessors to be the total taxable value of land and additions on the property. | Land | Improvement |
|---|---|---|---|---|
| 2025 | $4,742 | $497,750 | $159,787 | $337,963 |
| 2024 | $4,499 | $475,751 | $165,050 | $310,701 |
| 2023 | $4,373 | $815,000 | $187,593 | $627,407 |
| 2022 | $4,711 | $476,850 | $101,028 | $375,822 |
| 2021 | $4,227 | $638,000 | $151,459 | $486,541 |
| 2020 | $3,812 | $552,000 | $131,625 | $420,375 |
| 2019 | $3,991 | $566,000 | $124,726 | $441,274 |
| 2018 | $3,617 | $515,000 | $110,504 | $404,496 |
| 2016 | $3,177 | $233,365 | $48,814 | $184,551 |
| 2015 | $2,723 | $189,915 | $48,814 | $141,101 |
| 2014 | $2,480 | $176,856 | $48,814 | $128,042 |
| 2013 | -- | $213,450 | $45,399 | $168,051 |
Source: Public Records
Map
Nearby Homes
- 245 S Summer Breeze Ln
- 101 S 3600 W
- 3535 W Overlook Dr
- 3583 W 200 S
- 454 N 3550 W
- 2794 W Gentile St
- 567 W 3575 S
- 697 N 3275 W
- 3169 S 550 W
- 3263 W 850 N
- 2875 N Hill Rd Unit 199
- 2875 N Hill Rd Unit 27
- 306 S Sunburst Dr
- 2674 S 75 E
- 818 N 2625 W
- 967 W Yamada Ct
- 2681 S 200 E
- 3391 W 1125 N
- 162 E 2600 S
- 2184 W Gentile St