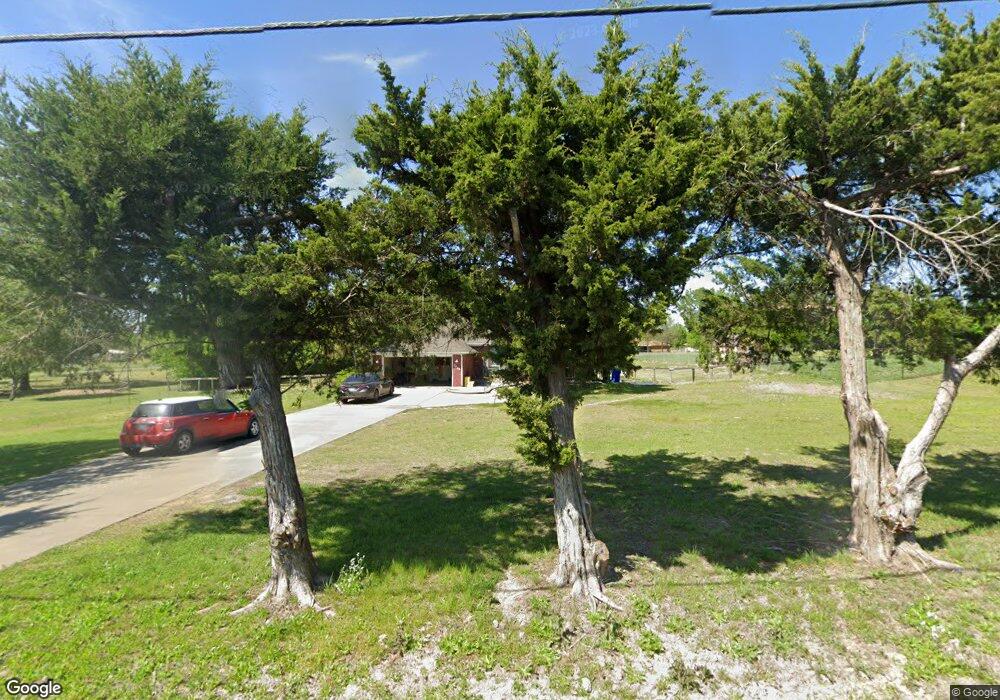
3229 W Lamberth Rd Sherman, TX 75092
Estimated Value: $317,418 - $367,000
3
Beds
2
Baths
1,664
Sq Ft
$206/Sq Ft
Est. Value
About This Home
This home is located at 3229 W Lamberth Rd, Sherman, TX 75092 and is currently estimated at $342,355, approximately $205 per square foot. 3229 W Lamberth Rd is a home located in Grayson County with nearby schools including S&S Consolidated Elementary School, S&S Consolidated Middle School, and S. & S. Cons H.S..
Ownership History
Date
Name
Owned For
Owner Type
Purchase Details
Closed on
Jun 4, 2018
Sold by
Hummert Michael S and Hummert Lauren I
Bought by
Perez Mavi and Montes Jorge
Current Estimated Value
Purchase Details
Closed on
Oct 17, 2011
Sold by
Wojciechowski Jan and Wojciechowski Beata
Bought by
Hummert Michael S and Hummert Lauren I
Home Financials for this Owner
Home Financials are based on the most recent Mortgage that was taken out on this home.
Original Mortgage
$115,200
Interest Rate
4.28%
Mortgage Type
New Conventional
Purchase Details
Closed on
Jul 9, 2010
Sold by
Hendrix Johnny and Hendrix Terri
Bought by
Wojciechowski Jan and Wojciechowska Beata
Home Financials for this Owner
Home Financials are based on the most recent Mortgage that was taken out on this home.
Original Mortgage
$10,000
Interest Rate
4.77%
Mortgage Type
Seller Take Back
Create a Home Valuation Report for This Property
The Home Valuation Report is an in-depth analysis detailing your home's value as well as a comparison with similar homes in the area
Home Values in the Area
Average Home Value in this Area
Purchase History
| Date | Buyer | Sale Price | Title Company |
|---|---|---|---|
| Perez Mavi | -- | Red River Title Co | |
| Hummert Michael S | -- | Red River Title Co | |
| Wojciechowski Jan | -- | Grayson County Title |
Source: Public Records
Mortgage History
| Date | Status | Borrower | Loan Amount |
|---|---|---|---|
| Previous Owner | Hummert Michael S | $115,200 | |
| Previous Owner | Wojciechowski Jan | $10,000 |
Source: Public Records
Tax History Compared to Growth
Tax History
| Year | Tax Paid | Tax Assessment Tax Assessment Total Assessment is a certain percentage of the fair market value that is determined by local assessors to be the total taxable value of land and additions on the property. | Land | Improvement |
|---|---|---|---|---|
| 2025 | $6,480 | $320,408 | $138,282 | $182,126 |
| 2024 | $6,480 | $324,421 | $140,183 | $184,238 |
| 2023 | $6,993 | $349,731 | $135,906 | $213,825 |
| 2022 | $5,973 | $278,111 | $79,358 | $198,753 |
| 2021 | $5,459 | $228,774 | $63,676 | $165,098 |
| 2020 | $5,579 | $228,138 | $63,676 | $164,462 |
| 2019 | $5,198 | $203,983 | $46,569 | $157,414 |
| 2018 | $3,533 | $149,146 | $20,107 | $129,039 |
| 2017 | $3,379 | $143,811 | $20,301 | $123,510 |
| 2016 | $3,090 | $145,322 | $16,388 | $128,934 |
| 2015 | $1,923 | $119,559 | $13,111 | $106,448 |
| 2014 | $2,009 | $117,193 | $13,111 | $104,082 |
Source: Public Records
Map
Nearby Homes
- 2201 Norwood St
- 2202 Carriage Estates Rd
- 2712 Hillview Ln
- 2816 Hillview Ln
- 2809 Hillview Ln
- 2801 La Paloma
- 2808 Hillview Ln
- 2812 La Paloma
- 2213 Trailside Dr
- 2420 Remuda Dr
- 2220 Trailside Dr
- 2224 Trailside Dr
- 2228 Trailside Dr
- 2232 Trailside Dr
- 2302 Trailside Dr
- 2505 Remuda Dr
- Birchwood G Plan at Canyon Creek Estates
- Telford G Plan at Canyon Creek Estates
- Chesterfield G Plan at Canyon Creek Estates
- Foxleigh G Plan at Canyon Creek Estates
- 3285 W Lamberth Rd
- 3187 W Lamberth Rd
- 3161 W Lamberth Rd
- 218 Carriage Cir
- 3212 W Lamberth Rd
- 3186 W Lamberth Rd
- 3328 Carriage Cir
- 164 Carriage Estates Rd
- 2305 Carriage Estates Rd
- 3324 Carriage Cir
- 3324 Carriage Cir
- 3305 W Lamberth Rd
- 158 Carriage Cir
- 3160 W Lamberth Rd
- 244 Carriage Cir
- 3111 W Lamberth Rd
- 290 Carriage Cir
- 210 Carriage Cir
- 246 Carriage Cir
- 2301 Carriage Estates Rd