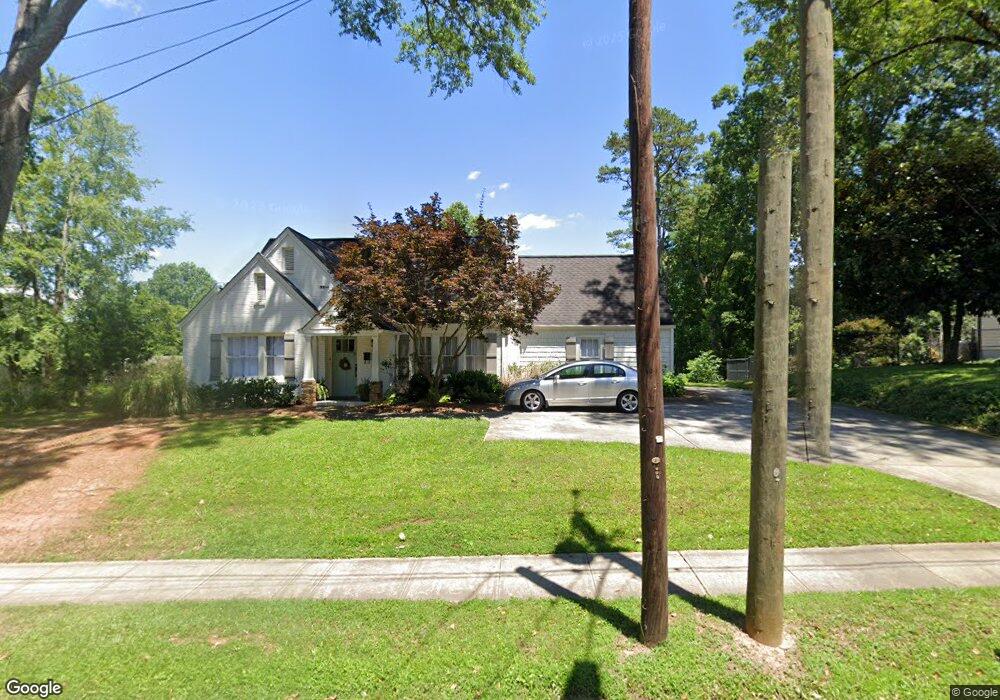
323 Athens St Jefferson, GA 30549
Estimated Value: $208,000 - $310,000
2
Beds
2
Baths
1,336
Sq Ft
$200/Sq Ft
Est. Value
About This Home
This home is located at 323 Athens St, Jefferson, GA 30549 and is currently estimated at $266,968, approximately $199 per square foot. 323 Athens St is a home located in Jackson County with nearby schools including Jefferson Elementary School, Jefferson Academy, and Jefferson Middle School.
Ownership History
Date
Name
Owned For
Owner Type
Purchase Details
Closed on
Jul 22, 2017
Sold by
Main Earl Carlisle
Bought by
Main Allison Paige
Current Estimated Value
Purchase Details
Closed on
Apr 14, 2015
Sold by
Crews Jerri Celeste
Bought by
Main Allison Paige and Main Earl C
Home Financials for this Owner
Home Financials are based on the most recent Mortgage that was taken out on this home.
Original Mortgage
$111,823
Interest Rate
3.5%
Mortgage Type
FHA
Purchase Details
Closed on
Nov 1, 2007
Sold by
Not Provided
Bought by
Crews Jerri Celeste
Home Financials for this Owner
Home Financials are based on the most recent Mortgage that was taken out on this home.
Original Mortgage
$101,343
Interest Rate
6.26%
Mortgage Type
New Conventional
Purchase Details
Closed on
Jun 6, 2001
Sold by
Morehead Lula Mae
Bought by
Cooper R E
Purchase Details
Closed on
Apr 6, 1999
Sold by
Morehead Lula Mae
Bought by
Cooper Cooper R and Cooper Lucille
Create a Home Valuation Report for This Property
The Home Valuation Report is an in-depth analysis detailing your home's value as well as a comparison with similar homes in the area
Home Values in the Area
Average Home Value in this Area
Purchase History
| Date | Buyer | Sale Price | Title Company |
|---|---|---|---|
| Main Allison Paige | -- | -- | |
| Main Allison Paige | $115,000 | -- | |
| Crews Jerri Celeste | $50,000 | -- | |
| Cooper R E | -- | -- | |
| Cooper Cooper R | -- | -- |
Source: Public Records
Mortgage History
| Date | Status | Borrower | Loan Amount |
|---|---|---|---|
| Previous Owner | Main Allison Paige | $111,823 | |
| Previous Owner | Crews Jerri Celeste | $101,343 |
Source: Public Records
Tax History
| Year | Tax Paid | Tax Assessment Tax Assessment Total Assessment is a certain percentage of the fair market value that is determined by local assessors to be the total taxable value of land and additions on the property. | Land | Improvement |
|---|---|---|---|---|
| 2024 | $1,935 | $71,000 | $21,080 | $49,920 |
| 2023 | $1,943 | $64,240 | $21,080 | $43,160 |
| 2022 | $1,630 | $51,280 | $17,560 | $33,720 |
| 2021 | $1,660 | $51,280 | $17,560 | $33,720 |
| 2020 | $1,767 | $51,040 | $17,560 | $33,480 |
| 2019 | $1,794 | $51,040 | $17,560 | $33,480 |
| 2018 | $1,770 | $49,400 | $17,560 | $31,840 |
| 2017 | $1,757 | $48,049 | $17,582 | $30,467 |
| 2016 | $1,566 | $42,608 | $12,141 | $30,467 |
| 2015 | $1,771 | $47,993 | $16,745 | $31,248 |
| 2014 | $1,736 | $46,580 | $16,745 | $29,834 |
| 2013 | -- | $46,579 | $16,745 | $29,834 |
Source: Public Records
Map
Nearby Homes
- 336 Gordon St
- 225 Borders St
- 0 Curry Dr Unit LOT 30
- 0 Curry Dr Unit 7665673
- 0 Curry Dr Unit 7666260
- 0 Curry Dr Unit LOT 6
- 0 Curry Dr Unit LOT 14
- 0 Curry Dr Unit LOT 32
- 0 Curry Dr Unit 7665753
- 0 Curry Dr Unit LOT 31
- 0 Curry Dr Unit 7666653
- 0 Curry Dr Unit LOT 13
- 0 Curry Dr Unit LOT 35
- 0 Curry Dr Unit 7665736
- 0 Curry Dr Unit 7666371
- 0 Curry Dr Unit LOT 29
- 0 Curry Dr Unit 7665727
- 0 Curry Dr Unit LOT 34
- 0 Curry Dr Unit LOT 33
- 0 Curry Dr Unit LOT 37
Your Personal Tour Guide
Ask me questions while you tour the home.