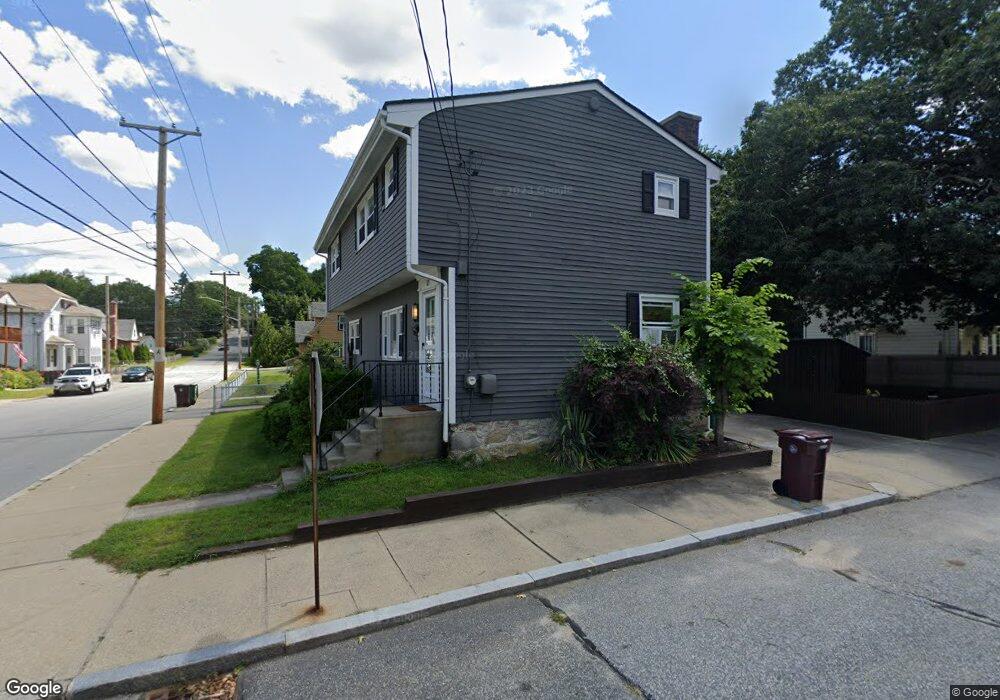
323 Ballou St Woonsocket, RI 02895
Globe District NeighborhoodEstimated Value: $367,000 - $386,000
3
Beds
2
Baths
1,722
Sq Ft
$219/Sq Ft
Est. Value
About This Home
This home is located at 323 Ballou St, Woonsocket, RI 02895 and is currently estimated at $377,633, approximately $219 per square foot. 323 Ballou St is a home located in Providence County with nearby schools including Woonsocket High School, Founders Academy, and Beacon Charter School.
Ownership History
Date
Name
Owned For
Owner Type
Purchase Details
Closed on
Aug 28, 2008
Sold by
Wells Fargo Bank Na
Bought by
Montanari Lori
Current Estimated Value
Purchase Details
Closed on
Aug 1, 2006
Sold by
Cochrane Douglas A
Bought by
Carr Amy and Kosciusko David
Purchase Details
Closed on
Sep 20, 2005
Sold by
Fontaine Paul
Bought by
Cochrane Douglas A
Purchase Details
Closed on
Nov 26, 2001
Sold by
Fontaine Rachel G
Bought by
Fontaine Paul
Create a Home Valuation Report for This Property
The Home Valuation Report is an in-depth analysis detailing your home's value as well as a comparison with similar homes in the area
Home Values in the Area
Average Home Value in this Area
Purchase History
| Date | Buyer | Sale Price | Title Company |
|---|---|---|---|
| Montanari Lori | $182,750 | -- | |
| Carr Amy | $234,000 | -- | |
| Cochrane Douglas A | $200,000 | -- | |
| Fontaine Paul | $128,000 | -- | |
| Montanari Lori | $182,750 | -- | |
| Carr Amy | $234,000 | -- | |
| Cochrane Douglas A | $200,000 | -- | |
| Fontaine Paul | $128,000 | -- |
Source: Public Records
Mortgage History
| Date | Status | Borrower | Loan Amount |
|---|---|---|---|
| Open | Fontaine Paul | $150,743 | |
| Closed | Fontaine Paul | $160,538 |
Source: Public Records
Tax History
| Year | Tax Paid | Tax Assessment Tax Assessment Total Assessment is a certain percentage of the fair market value that is determined by local assessors to be the total taxable value of land and additions on the property. | Land | Improvement |
|---|---|---|---|---|
| 2025 | $3,497 | $311,400 | $103,900 | $207,500 |
| 2024 | $3,391 | $233,200 | $92,200 | $141,000 |
| 2023 | $3,260 | $233,200 | $92,200 | $141,000 |
| 2022 | $3,260 | $233,200 | $92,200 | $141,000 |
| 2021 | $3,954 | $166,500 | $55,900 | $110,600 |
| 2020 | $3,996 | $166,500 | $55,900 | $110,600 |
| 2018 | $4,009 | $166,500 | $55,900 | $110,600 |
| 2017 | $3,991 | $132,600 | $45,300 | $87,300 |
| 2016 | $4,222 | $132,600 | $45,300 | $87,300 |
| 2015 | $4,851 | $132,600 | $45,300 | $87,300 |
| 2014 | $4,600 | $128,000 | $49,900 | $78,100 |
Source: Public Records
Map
Nearby Homes
- 43 Summit St
- 80 Summit St
- 184 Avenue C Unit 2
- 184 Avenue C Unit 5
- 184 Avenue C Unit 6
- 184 Avenue C Unit 3
- 184 Avenue C Unit 4
- 184 Avenue C Unit 1
- 604 Providence St
- 1 Admiral St
- 190 Coe St
- 1060 Park Ave
- 435 S Main St
- 122 Grand St
- 25 Ormond St
- 84 Bernice Ave
- 0 Holbrook Ln Unit 1402850
- 92 Rockland Ave
- 147 Warwick St
- 109 Hemond Ave
Your Personal Tour Guide
Ask me questions while you tour the home.