323 Bruns Ave Celina, OH 45822
Estimated Value: $296,669 - $448,000
3
Beds
3
Baths
1,804
Sq Ft
$198/Sq Ft
Est. Value
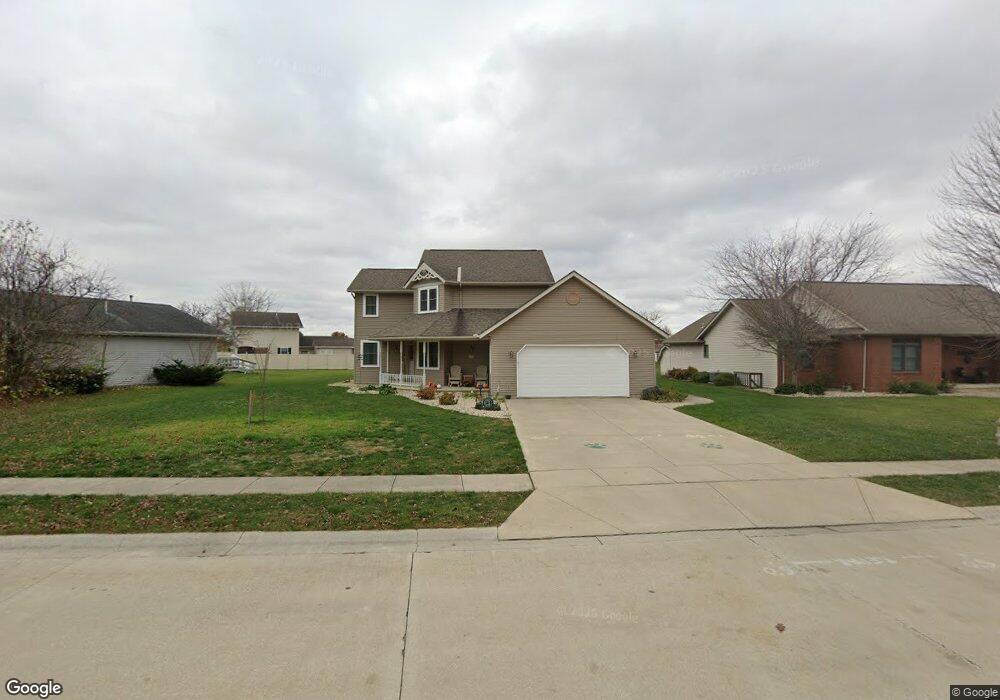
About This Home
This home is located at 323 Bruns Ave, Celina, OH 45822 and is currently estimated at $356,917, approximately $197 per square foot. 323 Bruns Ave is a home located in Mercer County with nearby schools including Celina Middle School, Celina High School, and Immaculate Conception School.
Ownership History
Date
Name
Owned For
Owner Type
Purchase Details
Closed on
Aug 1, 2018
Sold by
Sinder Ronald W and Sinder Marlene A
Bought by
Bath Aaron J and Bath Lindsay B
Current Estimated Value
Home Financials for this Owner
Home Financials are based on the most recent Mortgage that was taken out on this home.
Original Mortgage
$212,000
Outstanding Balance
$184,113
Interest Rate
4.5%
Mortgage Type
Purchase Money Mortgage
Estimated Equity
$172,804
Purchase Details
Closed on
Apr 6, 1993
Bought by
Snider Ronald W and Snider Marlene A
Create a Home Valuation Report for This Property
The Home Valuation Report is an in-depth analysis detailing your home's value as well as a comparison with similar homes in the area
Home Values in the Area
Average Home Value in this Area
Purchase History
| Date | Buyer | Sale Price | Title Company |
|---|---|---|---|
| Bath Aaron J | $245,000 | None Available | |
| Snider Ronald W | $19,700 | -- |
Source: Public Records
Mortgage History
| Date | Status | Borrower | Loan Amount |
|---|---|---|---|
| Open | Bath Aaron J | $212,000 |
Source: Public Records
Tax History Compared to Growth
Tax History
| Year | Tax Paid | Tax Assessment Tax Assessment Total Assessment is a certain percentage of the fair market value that is determined by local assessors to be the total taxable value of land and additions on the property. | Land | Improvement |
|---|---|---|---|---|
| 2024 | $3,382 | $85,790 | $13,790 | $72,000 |
| 2023 | $3,382 | $85,790 | $13,790 | $72,000 |
| 2022 | $2,973 | $65,840 | $10,220 | $55,620 |
| 2021 | $2,981 | $65,840 | $10,220 | $55,620 |
| 2020 | $2,497 | $65,840 | $10,220 | $55,620 |
| 2019 | $2,144 | $53,030 | $8,370 | $44,660 |
| 2018 | $2,229 | $53,030 | $8,370 | $44,660 |
| 2017 | $2,230 | $53,030 | $8,370 | $44,660 |
| 2016 | $2,130 | $51,280 | $9,140 | $42,140 |
| 2015 | $2,068 | $51,280 | $9,140 | $42,140 |
| 2014 | $2,073 | $51,280 | $9,140 | $42,140 |
| 2013 | $2,019 | $47,010 | $8,370 | $38,640 |
Source: Public Records
Map
Nearby Homes
- 1528 Mary Ln
- 1312 Michael Ave
- 1218 Brittany Dr
- 905 N Walnut St
- 727 N Brandon Ave
- 628 Hoying St
- 541 Lisle St
- 611 N Sugar St
- 680 N Main St
- 316 Dogwood Dr
- 112 Zillah St
- 409 W Fayette St
- 2010 Barnsbury Ct
- 110 N Cherry St
- 301 E Market St
- 808 W Logan St
- 502 S Sugar St
- 629 E Livingston St
- 802 E Market St
- 217 Lakeview Dr