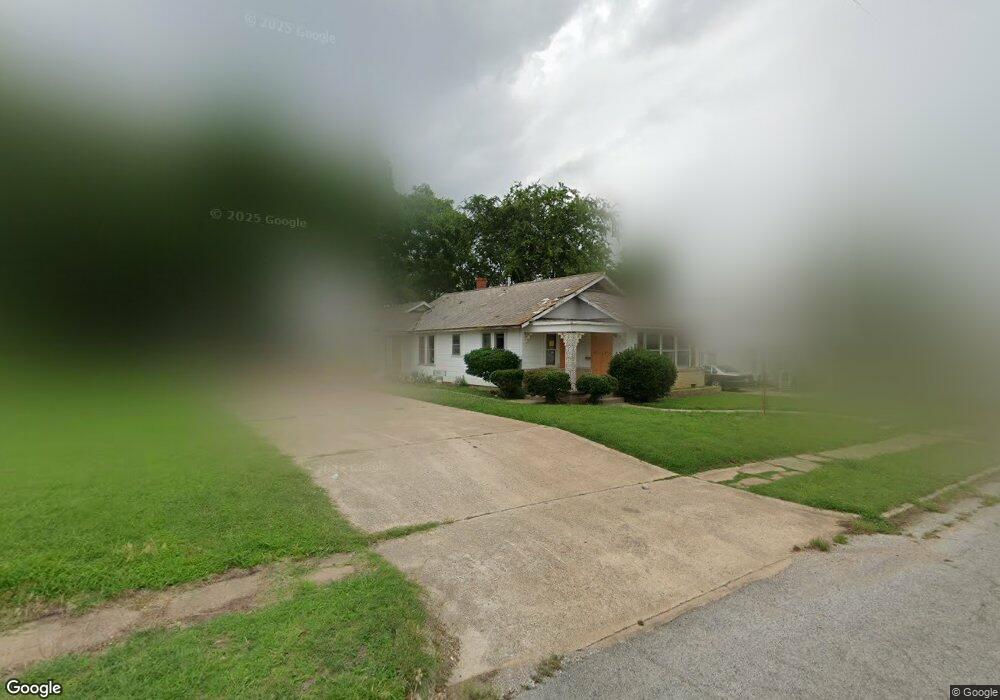
323 C St SE Ardmore, OK 73401
Estimated Value: $118,000 - $150,000
3
Beds
2
Baths
1,732
Sq Ft
$77/Sq Ft
Est. Value
About This Home
This home is located at 323 C St SE, Ardmore, OK 73401 and is currently estimated at $132,510, approximately $76 per square foot. 323 C St SE is a home located in Carter County with nearby schools including Jefferson Elementary School, Ardmore Middle School, and Ardmore High School.
Ownership History
Date
Name
Owned For
Owner Type
Purchase Details
Closed on
Nov 4, 2023
Sold by
Payne Ed C and Blake Susan Rhodes
Bought by
Payne Ed C and Rhodes Blake Susan
Current Estimated Value
Purchase Details
Closed on
May 31, 2023
Sold by
Carter County Sheriff
Bought by
Cooper Mr
Purchase Details
Closed on
Feb 26, 1999
Sold by
Oxford Donald E and Oxford Sand
Bought by
Stone Jerry W and Stone Melba
Purchase Details
Closed on
Feb 19, 1999
Sold by
Oxford Iley
Bought by
Oxford Donald E and Oxford Sand
Purchase Details
Closed on
Nov 16, 1998
Sold by
Oxford Mary Irene
Bought by
Oxford Donald E and Oxford Sand
Purchase Details
Closed on
Jul 24, 1998
Sold by
Oxford Iley
Bought by
Oxford Mary Irene
Purchase Details
Closed on
Jun 26, 1998
Sold by
Oxford I E
Bought by
Oxford Mary Irene
Create a Home Valuation Report for This Property
The Home Valuation Report is an in-depth analysis detailing your home's value as well as a comparison with similar homes in the area
Purchase History
| Date | Buyer | Sale Price | Title Company |
|---|---|---|---|
| Payne Ed C | -- | None Listed On Document | |
| Cooper Mr | -- | None Listed On Document | |
| Stone Jerry W | $47,500 | -- | |
| Oxford Donald E | -- | -- | |
| Oxford Donald E | -- | -- | |
| Oxford Mary Irene | -- | -- | |
| Oxford Mary Irene | -- | -- |
Source: Public Records
Tax History
| Year | Tax Paid | Tax Assessment Tax Assessment Total Assessment is a certain percentage of the fair market value that is determined by local assessors to be the total taxable value of land and additions on the property. | Land | Improvement |
|---|---|---|---|---|
| 2025 | $424 | $4,248 | $900 | $3,348 |
| 2024 | $424 | $11,023 | $900 | $10,123 |
| 2023 | $1,100 | $6,375 | $569 | $5,806 |
| 2022 | $418 | $6,375 | $664 | $5,711 |
| 2021 | $441 | $6,375 | $726 | $5,649 |
| 2020 | $435 | $6,374 | $416 | $5,958 |
| 2019 | $425 | $6,375 | $475 | $5,900 |
| 2018 | $432 | $6,375 | $475 | $5,900 |
| 2017 | $400 | $6,375 | $475 | $5,900 |
| 2016 | $408 | $6,375 | $475 | $5,900 |
| 2015 | $336 | $6,375 | $475 | $5,900 |
| 2014 | $464 | $6,189 | $475 | $5,714 |
Source: Public Records
Map
Nearby Homes