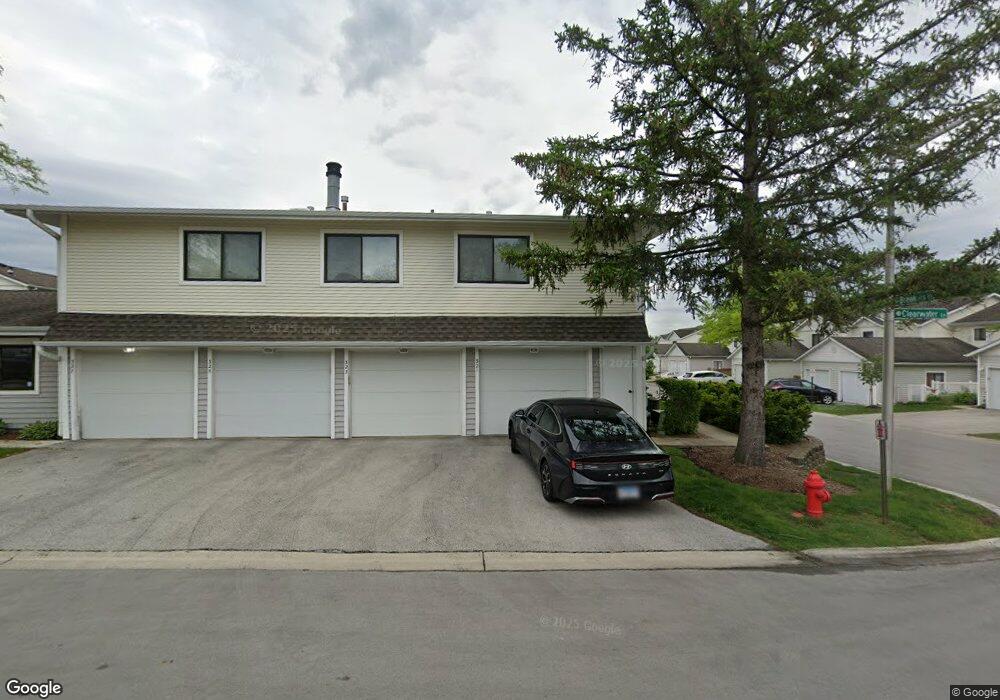
323 Clearwater Ln Unit 52C Schaumburg, IL 60194
East Schaumburg NeighborhoodEstimated Value: $210,353 - $305,000
2
Beds
--
Bath
1,440
Sq Ft
$181/Sq Ft
Est. Value
About This Home
This home is located at 323 Clearwater Ln Unit 52C, Schaumburg, IL 60194 and is currently estimated at $260,838, approximately $181 per square foot. 323 Clearwater Ln Unit 52C is a home located in Cook County with nearby schools including Everett Dirksen Elementary School, Robert Frost Junior High School, and J B Conant High School.
Ownership History
Date
Name
Owned For
Owner Type
Purchase Details
Closed on
Dec 19, 2006
Sold by
Prince Thomas L and Prince Doris J
Bought by
Prince Thomas L and Prince Doris J
Current Estimated Value
Purchase Details
Closed on
Oct 27, 1999
Sold by
Prince Jeffrey S
Bought by
Prince Thomas L and Prince Doris J
Home Financials for this Owner
Home Financials are based on the most recent Mortgage that was taken out on this home.
Original Mortgage
$75,000
Outstanding Balance
$23,124
Interest Rate
7.88%
Estimated Equity
$237,714
Purchase Details
Closed on
Nov 8, 1996
Sold by
Spapperi Kimberly
Bought by
Prince Jeffrey S
Purchase Details
Closed on
Apr 19, 1996
Sold by
Perkins David G
Bought by
Prince Jeffrey S and Spapperi Kimberly
Home Financials for this Owner
Home Financials are based on the most recent Mortgage that was taken out on this home.
Original Mortgage
$87,400
Interest Rate
7.91%
Create a Home Valuation Report for This Property
The Home Valuation Report is an in-depth analysis detailing your home's value as well as a comparison with similar homes in the area
Home Values in the Area
Average Home Value in this Area
Purchase History
| Date | Buyer | Sale Price | Title Company |
|---|---|---|---|
| Prince Thomas L | -- | None Available | |
| Prince Thomas L | $102,500 | -- | |
| Prince Jeffrey S | -- | -- | |
| Prince Jeffrey S | $92,000 | -- |
Source: Public Records
Mortgage History
| Date | Status | Borrower | Loan Amount |
|---|---|---|---|
| Open | Prince Thomas L | $75,000 | |
| Previous Owner | Prince Jeffrey S | $87,400 |
Source: Public Records
Tax History Compared to Growth
Tax History
| Year | Tax Paid | Tax Assessment Tax Assessment Total Assessment is a certain percentage of the fair market value that is determined by local assessors to be the total taxable value of land and additions on the property. | Land | Improvement |
|---|---|---|---|---|
| 2024 | $2,118 | $13,530 | $2,891 | $10,639 |
| 2023 | $358 | $13,530 | $2,891 | $10,639 |
| 2022 | $358 | $13,530 | $2,891 | $10,639 |
| 2021 | $389 | $11,762 | $3,704 | $8,058 |
| 2020 | $1,840 | $11,762 | $3,704 | $8,058 |
| 2019 | $3,505 | $13,075 | $3,704 | $9,371 |
| 2018 | $1,433 | $10,960 | $3,117 | $7,843 |
| 2017 | $3,237 | $10,960 | $3,117 | $7,843 |
| 2016 | $3,027 | $10,960 | $3,117 | $7,843 |
| 2015 | $2,450 | $8,188 | $2,710 | $5,478 |
| 2014 | $2,423 | $8,188 | $2,710 | $5,478 |
| 2013 | $2,050 | $8,837 | $2,710 | $6,127 |
Source: Public Records
Map
Nearby Homes
- 325 Bayview Point Unit 56B
- 751 Edgelake Point Unit 68C
- 601 Hanover Ct Unit Z2
- 602 Eastview Ct Unit Z1
- 600 Eastview Ct Unit X1
- 121 Chatsworth Cir
- 802 Stonewall Ct Unit 55
- 465 Apache Ln
- 22 Ascot Cir
- 28 Ascot Cir
- 705 Ash Rd
- 85 Marble Hill Ct Unit A1
- 350 Newgate Ct Unit 2Z
- 91 Lambert Dr Unit B1
- 147 Fulbright Ln
- 223 Gareth Ln
- 153 Fulbright Ln
- 845 Dracut Ln
- 287 Pembridge Ln Unit B2
- 22 Waterbury Ln Unit N1
- 321 Clearwater Ln Unit 52D
- 321 Clearwater Ln Unit 321
- 325 Clearwater Ln Unit 52B
- 327 Clearwater Ln Unit 52A
- 331 Clearwater Ln Unit 51B
- 331 Clearwater Ln Unit 331
- 314 Clearwater Ln Unit 35C
- 329 Clearwater Ln Unit 51A
- 613 Breakers Point Unit 33C
- 611 Breakers Point Unit 34E
- 320 Clearwater Ln Unit 36C
- 318 Clearwater Ln Unit 36B
- 615 Breakers Point Unit 33B
- 333 Clearwater Ln Unit 51C
- 617 Breakers Point Unit 32E
- 624 Breakers Point Unit 53C
- 622 Breakers Point Unit 53D
- 316 Clearwater Ln Unit 35A
- 324 Clearwater Ln Unit 37B
- 619 Breakers Point Unit 32C