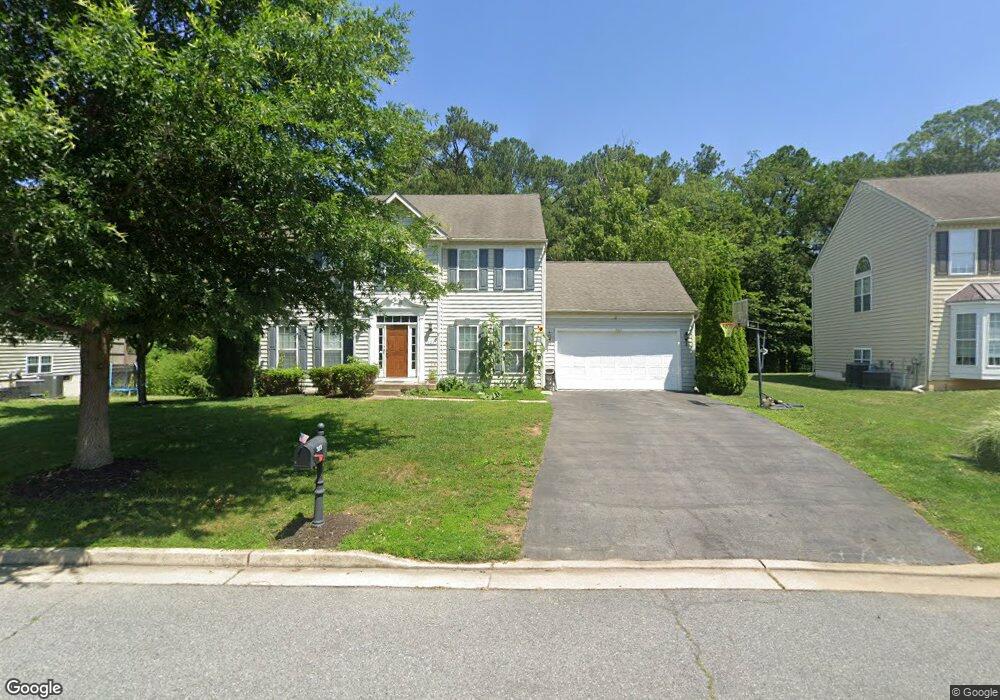
323 Devon Dr Chestertown, MD 21620
Estimated Value: $461,970 - $522,000
Studio
3
Baths
2,462
Sq Ft
$197/Sq Ft
Est. Value
About This Home
This home is located at 323 Devon Dr, Chestertown, MD 21620 and is currently estimated at $485,743, approximately $197 per square foot. 323 Devon Dr is a home located in Kent County with nearby schools including Kent County Middle School, Kent County High School, and Chestertown Christian Academy.
Ownership History
Date
Name
Owned For
Owner Type
Purchase Details
Closed on
Feb 26, 2008
Sold by
Nvr Inc
Bought by
Hickmkan Dennis W
Current Estimated Value
Home Financials for this Owner
Home Financials are based on the most recent Mortgage that was taken out on this home.
Original Mortgage
$236,917
Outstanding Balance
$148,858
Interest Rate
5.9%
Mortgage Type
Purchase Money Mortgage
Estimated Equity
$336,885
Purchase Details
Closed on
Feb 8, 2008
Sold by
Nvr Inc
Bought by
Hickmkan Dennis W
Home Financials for this Owner
Home Financials are based on the most recent Mortgage that was taken out on this home.
Original Mortgage
$236,917
Outstanding Balance
$148,858
Interest Rate
5.9%
Mortgage Type
Purchase Money Mortgage
Estimated Equity
$336,885
Purchase Details
Closed on
Nov 29, 2007
Sold by
Sturbridge Coventry Farms Llc
Bought by
Nvr Inc
Purchase Details
Closed on
Nov 14, 2007
Sold by
Sturbridge Coventry Farms Llc
Bought by
Nvr Inc
Create a Home Valuation Report for This Property
The Home Valuation Report is an in-depth analysis detailing your home's value as well as a comparison with similar homes in the area
Home Values in the Area
Average Home Value in this Area
Purchase History
| Date | Buyer | Sale Price | Title Company |
|---|---|---|---|
| Hickmkan Dennis W | $278,727 | -- | |
| Hickmkan Dennis W | $278,727 | -- | |
| Nvr Inc | $84,699 | -- | |
| Nvr Inc | $84,699 | -- |
Source: Public Records
Mortgage History
| Date | Status | Borrower | Loan Amount |
|---|---|---|---|
| Open | Hickmkan Dennis W | $236,917 | |
| Closed | Hickmkan Dennis W | $236,917 |
Source: Public Records
Tax History
| Year | Tax Paid | Tax Assessment Tax Assessment Total Assessment is a certain percentage of the fair market value that is determined by local assessors to be the total taxable value of land and additions on the property. | Land | Improvement |
|---|---|---|---|---|
| 2025 | $4,792 | $318,700 | $70,400 | $248,300 |
| 2024 | $4,561 | $300,233 | $0 | $0 |
| 2023 | $4,339 | $281,767 | $0 | $0 |
| 2022 | $4,100 | $263,300 | $65,400 | $197,900 |
| 2021 | $3,874 | $255,233 | $0 | $0 |
| 2020 | $3,874 | $247,167 | $0 | $0 |
| 2019 | $3,740 | $239,100 | $65,400 | $173,700 |
| 2018 | $3,697 | $237,900 | $0 | $0 |
| 2017 | $3,560 | $236,700 | $0 | $0 |
| 2016 | -- | $235,500 | $0 | $0 |
| 2015 | $3,360 | $231,467 | $0 | $0 |
| 2014 | $3,360 | $227,433 | $0 | $0 |
Source: Public Records
Map
Nearby Homes
- 116 Harlan Loop
- 311 Devon Dr
- 206 Camelot Dr
- 0 Cromwell Clark Rd
- 100 Adela Way
- 218 Camelot Dr
- 110 Trafford Dr
- 301 Lincoln Dr
- Lot 9 Prestwick Dr
- 2 Scheeler Rd
- 107 Oak Leaf Dr
- 107 Metcalfe Rd
- 112 Metcalf Rd
- 109 Metcalfe Rd
- 3 Haacke Dr
- 304 Hadaway Dr
- 201 Greenwood Ave
- 132 Prospect St
- 0 Elm St Unit MDKE2003590
- 201 N Lynchburg St
Your Personal Tour Guide
Ask me questions while you tour the home.