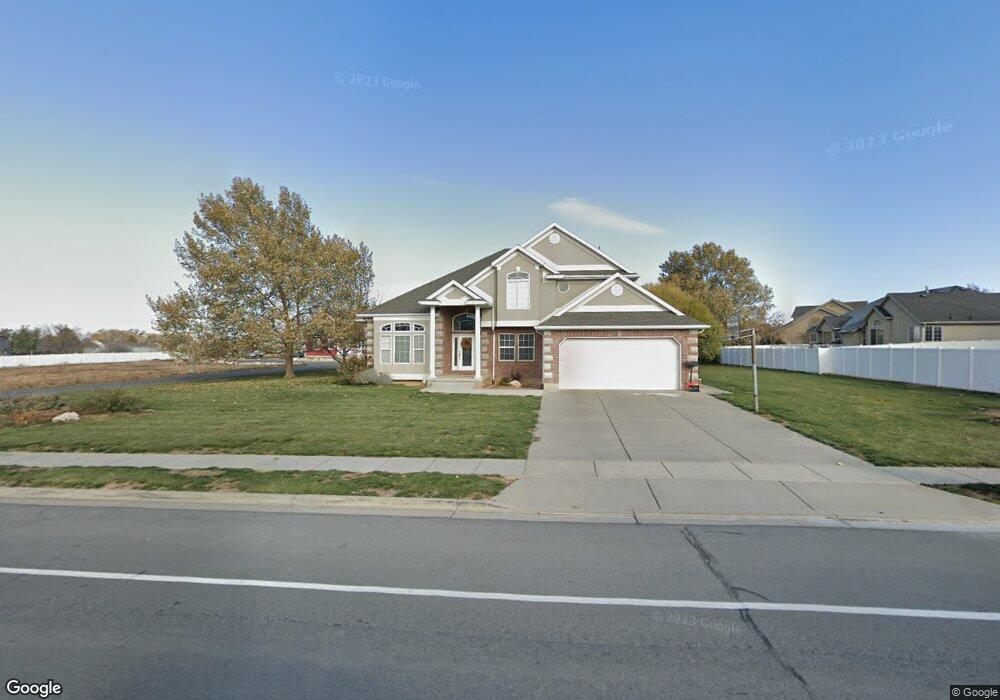
323 E 1900 S Clearfield, UT 84015
Estimated Value: $517,000 - $641,000
3
Beds
3
Baths
2,379
Sq Ft
$248/Sq Ft
Est. Value
About This Home
This home is located at 323 E 1900 S, Clearfield, UT 84015 and is currently estimated at $589,969, approximately $247 per square foot. 323 E 1900 S is a home located in Davis County with nearby schools including Antelope Elementary School, North Davis Junior High School, and Clearfield High School.
Ownership History
Date
Name
Owned For
Owner Type
Purchase Details
Closed on
May 8, 2023
Sold by
Chelemes Sam James
Bought by
Madec Enterprises Lc
Current Estimated Value
Purchase Details
Closed on
Dec 8, 2022
Sold by
Likens David W and Likens Andrea C
Bought by
Likens Family Revocable Living Trust
Purchase Details
Closed on
Dec 11, 2000
Sold by
Baker Construction Inc
Bought by
Likens David W and Likens Andrea C
Purchase Details
Closed on
Sep 15, 2000
Sold by
Likens David and Likens Andrea C
Bought by
Baker Construction Inc
Home Financials for this Owner
Home Financials are based on the most recent Mortgage that was taken out on this home.
Original Mortgage
$180,000
Interest Rate
8.11%
Create a Home Valuation Report for This Property
The Home Valuation Report is an in-depth analysis detailing your home's value as well as a comparison with similar homes in the area
Home Values in the Area
Average Home Value in this Area
Purchase History
| Date | Buyer | Sale Price | Title Company |
|---|---|---|---|
| Madec Enterprises Lc | -- | None Listed On Document | |
| Likens Family Revocable Living Trust | -- | -- | |
| Likens Family Revocable Living Trust | -- | None Listed On Document | |
| Likens David W | -- | Bonneville Title Company Inc | |
| Baker Construction Inc | -- | Bonneville Title Company Inc |
Source: Public Records
Mortgage History
| Date | Status | Borrower | Loan Amount |
|---|---|---|---|
| Previous Owner | Baker Construction Inc | $180,000 | |
| Closed | Baker Construction Inc | $40,000 |
Source: Public Records
Tax History
| Year | Tax Paid | Tax Assessment Tax Assessment Total Assessment is a certain percentage of the fair market value that is determined by local assessors to be the total taxable value of land and additions on the property. | Land | Improvement |
|---|---|---|---|---|
| 2025 | $3,713 | $332,750 | $121,143 | $211,607 |
| 2024 | $3,570 | $322,300 | $115,369 | $206,931 |
| 2023 | $3,404 | $564,000 | $178,521 | $385,479 |
| 2022 | $3,554 | $318,450 | $96,593 | $221,857 |
| 2021 | $3,206 | $434,000 | $136,070 | $297,930 |
| 2020 | $2,796 | $376,000 | $121,748 | $254,252 |
| 2019 | $2,893 | $384,000 | $102,584 | $281,416 |
| 2018 | $2,730 | $353,000 | $91,054 | $261,946 |
| 2016 | $2,396 | $161,975 | $38,612 | $123,363 |
| 2015 | $2,338 | $150,700 | $38,612 | $112,088 |
| 2014 | $2,393 | $156,319 | $38,612 | $117,707 |
| 2013 | -- | $139,418 | $48,287 | $91,131 |
Source: Public Records
Map
Nearby Homes
- 460 E 1700 S Unit 1 & 2
- 1969 S 575 E
- 1877 S 725 E
- 906 E Sam Cir
- 195 E 2325 S
- 1250 N 2925 W
- 2345 S Main St
- 1685 S 245 W
- 1870 N Celia Way
- 1916 N Celia Way
- 1186 N 2425 W
- 369 W 1900 S
- 2480 S Main St
- 1876 W 1575 N Unit 237
- 1740 N Gregory Dr
- 1570 N 1875 W Unit 242
- 1570 N 1875 W
- 1558 N 1875 W
- 1558 N 1875 W Unit 245
- 3250 W 1075 N
Your Personal Tour Guide
Ask me questions while you tour the home.