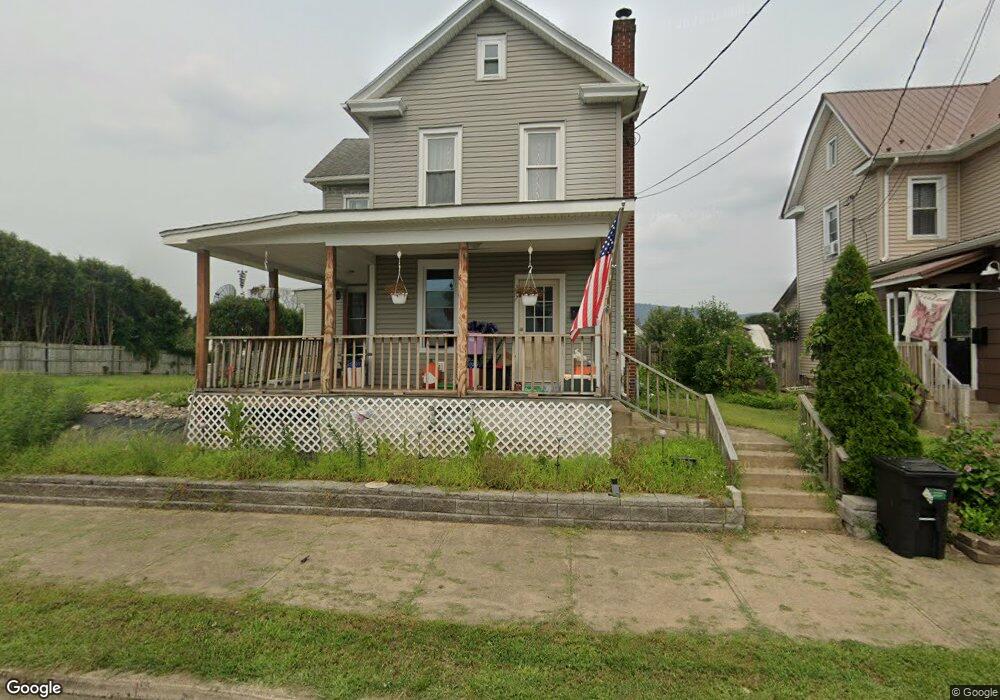
323 E 8th St Berwick, PA 18603
Estimated Value: $140,000 - $234,000
Studio
--
Bath
1,752
Sq Ft
$105/Sq Ft
Est. Value
About This Home
This home is located at 323 E 8th St, Berwick, PA 18603 and is currently estimated at $183,928, approximately $104 per square foot. 323 E 8th St is a home located in Columbia County with nearby schools including Berwick Area High School, Holy Family Consolidated School, and New Story School.
Ownership History
Date
Name
Owned For
Owner Type
Purchase Details
Closed on
Oct 20, 2020
Sold by
Malatesta Development Llc
Bought by
Aten Garrett M and Aten Kelsey M
Current Estimated Value
Home Financials for this Owner
Home Financials are based on the most recent Mortgage that was taken out on this home.
Original Mortgage
$168,078
Outstanding Balance
$149,224
Interest Rate
2.8%
Mortgage Type
VA
Estimated Equity
$34,704
Purchase Details
Closed on
Jun 8, 2020
Sold by
U S Bank National Association
Bought by
Malatesta Development Llc
Purchase Details
Closed on
Sep 18, 2019
Sold by
Miller Wayne N
Bought by
U S Bank National Association and The Cim Trust 2017 4
Purchase Details
Closed on
Dec 12, 2003
Bought by
Morris Brian Wayne
Create a Home Valuation Report for This Property
The Home Valuation Report is an in-depth analysis detailing your home's value as well as a comparison with similar homes in the area
Home Values in the Area
Average Home Value in this Area
Purchase History
| Date | Buyer | Sale Price | Title Company |
|---|---|---|---|
| Aten Garrett M | $164,300 | None Available | |
| Malatesta Development Llc | $42,000 | Servicelink Llc | |
| U S Bank National Association | $2,692 | None Available | |
| Morris Brian Wayne | $80,000 | -- |
Source: Public Records
Mortgage History
| Date | Status | Borrower | Loan Amount |
|---|---|---|---|
| Open | Aten Garrett M | $168,078 |
Source: Public Records
Tax History
| Year | Tax Paid | Tax Assessment Tax Assessment Total Assessment is a certain percentage of the fair market value that is determined by local assessors to be the total taxable value of land and additions on the property. | Land | Improvement |
|---|---|---|---|---|
| 2025 | $2,110 | $23,532 | $0 | $0 |
| 2024 | $2,086 | $23,532 | $3,300 | $20,232 |
| 2023 | $1,945 | $23,532 | $3,300 | $20,232 |
| 2022 | $1,881 | $23,532 | $3,300 | $20,232 |
| 2021 | $1,839 | $23,532 | $3,300 | $20,232 |
| 2020 | $1,797 | $23,532 | $3,300 | $20,232 |
| 2019 | $1,769 | $23,532 | $3,300 | $20,232 |
| 2018 | $1,699 | $23,532 | $3,300 | $20,232 |
| 2017 | $1,705 | $23,532 | $3,300 | $20,232 |
| 2016 | -- | $21,468 | $3,300 | $18,168 |
| 2015 | -- | $21,468 | $3,300 | $18,168 |
| 2014 | -- | $21,468 | $3,300 | $18,168 |
Source: Public Records
Map
Nearby Homes
- LOT 11,320 E 13th St
- 204 206 E 10 St
- 1006 Pine St
- 229 E 5th St
- LOT 5, 320 E 13th St
- 1308 Chestnut St
- 114 E 7th St
- 609 E 8th St
- 233 E 3rd St
- 217 E 3rd St
- 1201 N Market St
- 208 Pine St
- 911 N Mulberry St
- 239 E 15th St
- 539 E 2nd St
- 1624 Walnut St
- 1333 7th Ave
- 341 N Vine St
- 607 Maple St
- 305 Summerhill Ave
Your Personal Tour Guide
Ask me questions while you tour the home.