
Landlord's Agent in 2025
Joanne Breen
ERA Hart Sargis-Breen
(860) 944-3201
7 in this area
69 Total Sales
Estimated Value: $508,000 - $758,846
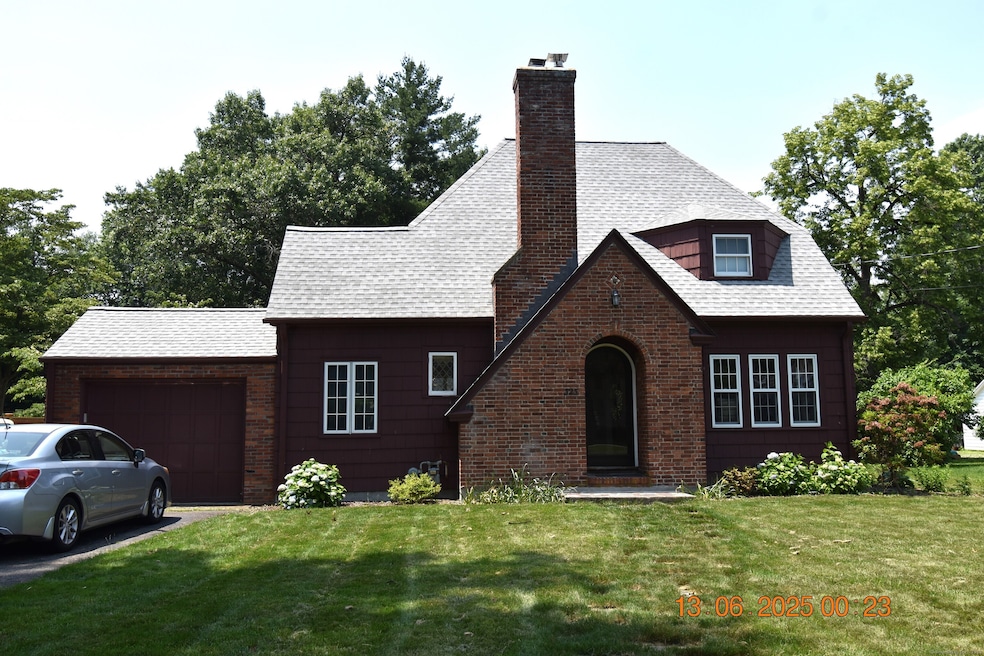
This charming Tudor home is available from Aug. 1, 2025 through June 30, 2026. Located in the heart of Old Wethersfield, you can enjoy perusing the quaint shops, bike ride to the cove or stroll along the green. This highly desirable historic district is one of the oldest in the country and provides a unique lifestyle unlike any other with year-round events that encourage participation. This home was updated with a two-story addition that has an open-concept kitchen/dining/family room plus a formal living room with gas fireplace or a den/library where you can escape with a good book. The level, deep backyard has a patio and gardens and is ideal for outdoor enjoyment. The owners would prefer to lease the home furnished but can provide some flexibility. There is an automatic standby generator that will be left for tenant's use. Sellers prefer to rent furnished but can be flexible. Ideal situation for an interim property if you are building a home or simply in between selling and buying.
Last Agent to Rent the Property
ERA Hart Sargis-Breen License #REB.0073462 Listed on: 06/12/2025
| Date | Buyer | Sale Price | Title Company |
|---|---|---|---|
| Sudell Sally | $290,000 | None Available | |
| Murphy Nancy A | -- | -- |
| Date | Status | Borrower | Loan Amount |
|---|---|---|---|
| Open | Sudell Sally | $232,000 |
| Date | Event | Price | List to Sale | Price per Sq Ft |
|---|---|---|---|---|
| 07/14/2025 07/14/25 | Rented | $4,100 | +2.5% | -- |
| 07/12/2025 07/12/25 | Under Contract | -- | -- | -- |
| 06/12/2025 06/12/25 | For Rent | $4,000 | -- | -- |
| Year | Tax Paid | Tax Assessment Tax Assessment Total Assessment is a certain percentage of the fair market value that is determined by local assessors to be the total taxable value of land and additions on the property. | Land | Improvement |
|---|---|---|---|---|
| 2025 | $16,427 | $398,520 | $141,120 | $257,400 |
| 2024 | $10,824 | $250,440 | $94,450 | $155,990 |
| 2023 | $10,463 | $250,440 | $94,450 | $155,990 |
| 2022 | $8,140 | $198,160 | $94,450 | $103,710 |
| 2021 | $8,059 | $198,160 | $94,450 | $103,710 |
| 2020 | $8,063 | $198,160 | $94,450 | $103,710 |
| 2019 | $8,073 | $198,160 | $94,450 | $103,710 |
| 2018 | $8,168 | $200,300 | $97,500 | $102,800 |
| 2017 | $7,966 | $200,300 | $97,500 | $102,800 |
| 2016 | $7,720 | $200,300 | $97,500 | $102,800 |
| 2015 | $7,649 | $200,300 | $97,500 | $102,800 |
| 2014 | $7,359 | $200,300 | $97,500 | $102,800 |
Landlord's Agent in 2025
Joanne Breen
ERA Hart Sargis-Breen
(860) 944-3201
7 in this area
69 Total Sales
Tenant's Agent in 2025
Kaethe Everett
ERA Hart Sargis-Breen
(860) 508-0995
36 Total Sales
Source: SmartMLS
MLS Number: 24100950
APN: WETH-000249-000000-000002
Disclaimer: Certain information contained herein is derived from information provided by parties other than Homes.com. All information provided is deemed reliable, but is not guaranteed to be accurate and should be independently verified.
![]() IDX information is provided exclusively for personal, non-commercial use, and may not be used for any purpose other than to identify prospective properties consumers may be interested in purchasing. Information is deemed reliable but not guaranteed.
IDX information is provided exclusively for personal, non-commercial use, and may not be used for any purpose other than to identify prospective properties consumers may be interested in purchasing. Information is deemed reliable but not guaranteed.
Ask me questions while you tour the home.