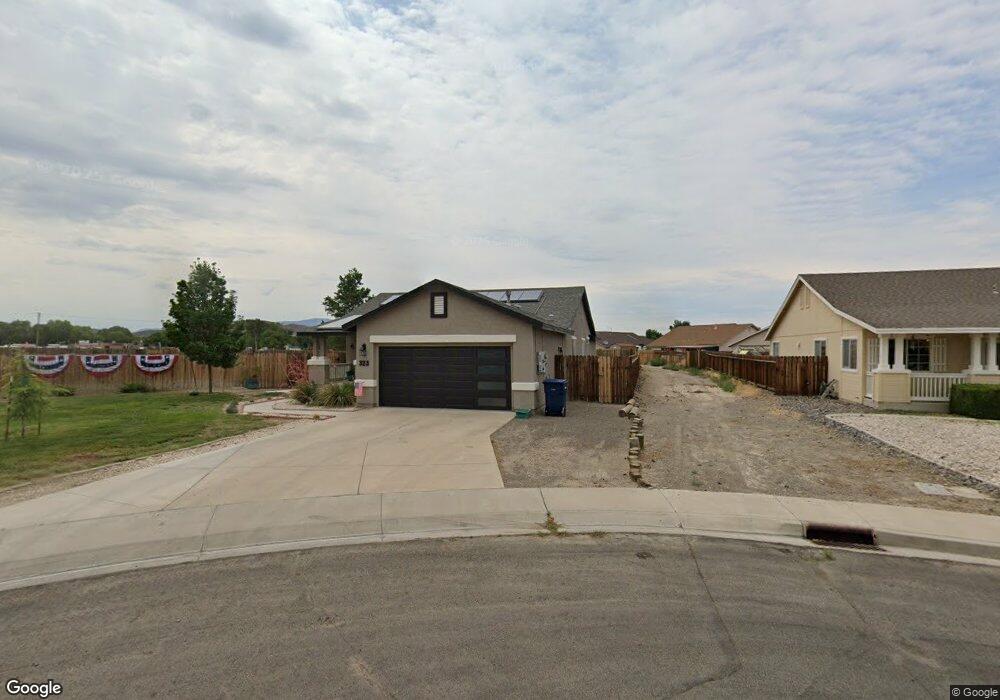
323 Marshall St Unit 2 Fernley, NV 89408
Estimated Value: $391,000 - $422,000
4
Beds
2
Baths
1,734
Sq Ft
$232/Sq Ft
Est. Value
About This Home
This home is located at 323 Marshall St Unit 2, Fernley, NV 89408 and is currently estimated at $402,652, approximately $232 per square foot. 323 Marshall St Unit 2 is a home located in Lyon County with nearby schools including Fernley Elementary School, Fernley Intermediate School, and Fernley High School.
Ownership History
Date
Name
Owned For
Owner Type
Purchase Details
Closed on
Feb 1, 2011
Sold by
Bode Richard I and Bode Sandra S
Bought by
Patten Paulette
Current Estimated Value
Home Financials for this Owner
Home Financials are based on the most recent Mortgage that was taken out on this home.
Original Mortgage
$111,917
Outstanding Balance
$76,181
Interest Rate
4.67%
Mortgage Type
New Conventional
Estimated Equity
$326,471
Purchase Details
Closed on
Nov 22, 2010
Sold by
Smith Benjamin P and Smith Andrea M
Bought by
Bode Richard I and Bode Sandra S
Purchase Details
Closed on
Jun 12, 2005
Sold by
Draughon Thomas H
Bought by
Smith Benjamin P and Smith Andrea M
Home Financials for this Owner
Home Financials are based on the most recent Mortgage that was taken out on this home.
Original Mortgage
$56,600
Interest Rate
5.65%
Mortgage Type
Stand Alone Second
Create a Home Valuation Report for This Property
The Home Valuation Report is an in-depth analysis detailing your home's value as well as a comparison with similar homes in the area
Home Values in the Area
Average Home Value in this Area
Purchase History
| Date | Buyer | Sale Price | Title Company |
|---|---|---|---|
| Patten Paulette | $108,000 | Western Title Company | |
| Bode Richard I | $64,600 | None Available | |
| Smith Benjamin P | $283,000 | Ticor Title Of Nevada Inc | |
| Draughon Thomas H | $283,000 | Ticor Title Of Nevada Inc |
Source: Public Records
Mortgage History
| Date | Status | Borrower | Loan Amount |
|---|---|---|---|
| Open | Patten Paulette | $111,917 | |
| Previous Owner | Draughon Thomas H | $56,600 | |
| Previous Owner | Smith Benjamin P | $226,400 |
Source: Public Records
Tax History Compared to Growth
Tax History
| Year | Tax Paid | Tax Assessment Tax Assessment Total Assessment is a certain percentage of the fair market value that is determined by local assessors to be the total taxable value of land and additions on the property. | Land | Improvement |
|---|---|---|---|---|
| 2025 | $1,671 | $103,819 | $43,750 | $60,069 |
| 2024 | $2,032 | $104,501 | $43,750 | $60,750 |
| 2023 | $2,032 | $93,837 | $36,750 | $57,087 |
| 2022 | $1,918 | $89,629 | $36,750 | $52,879 |
| 2021 | $1,899 | $78,066 | $26,250 | $51,816 |
| 2020 | $1,851 | $75,939 | $26,250 | $49,689 |
| 2019 | $1,825 | $74,226 | $26,250 | $47,976 |
| 2018 | $1,788 | $65,850 | $18,900 | $46,950 |
| 2017 | $1,780 | $55,470 | $8,400 | $47,070 |
| 2016 | $1,590 | $48,380 | $7,350 | $41,030 |
| 2015 | $1,625 | $39,425 | $7,350 | $32,075 |
| 2014 | $1,589 | $33,113 | $7,350 | $25,763 |
Source: Public Records
Map
Nearby Homes
- 110 Rachel St
- 321 Marshall St
- 319 Marshall St Unit 2
- 419 Sunshine Ln
- 417 Sunshine Ln
- 320 Marshall St
- 108 Rachel St
- 421 Sunshine Ln
- 415 Sunshine Ln
- 318 Marshall St
- 317 Marshall St
- 423 Sunshine Ln
- 413 Sunshine Ln
- 106 Rachel St Unit 1
- 316 Marshall St
- 209 Jason Ct
- 411 Sunshine Ln
- 315 Marshall St
- 104 Rachel St
- 700 Fall St