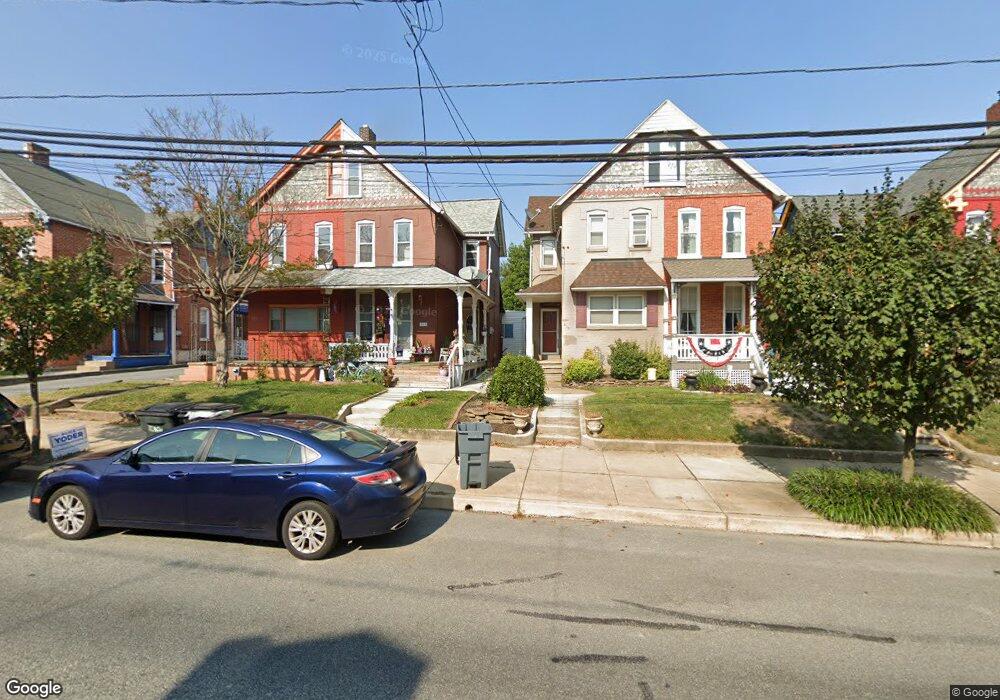
323 N 3rd St Columbia, PA 17512
Estimated Value: $192,000 - $241,000
2
Beds
2
Baths
1,755
Sq Ft
$120/Sq Ft
Est. Value
About This Home
This home is located at 323 N 3rd St, Columbia, PA 17512 and is currently estimated at $210,000, approximately $119 per square foot. 323 N 3rd St is a home located in Lancaster County with nearby schools including Columbia Middle School, Columbia High School, and Our Lady of the Angels School.
Ownership History
Date
Name
Owned For
Owner Type
Purchase Details
Closed on
Nov 30, 2012
Sold by
Hanna Ehab and Shehata Elham L
Bought by
Smith Derrick
Current Estimated Value
Home Financials for this Owner
Home Financials are based on the most recent Mortgage that was taken out on this home.
Original Mortgage
$75,600
Outstanding Balance
$52,082
Interest Rate
3.25%
Mortgage Type
FHA
Estimated Equity
$157,918
Purchase Details
Closed on
Jun 2, 2008
Sold by
Bernardi Roy A
Bought by
Hanna Ehab
Purchase Details
Closed on
Feb 12, 2008
Sold by
Citimortgage Inc
Bought by
Hud
Purchase Details
Closed on
Jan 30, 2008
Sold by
Boak William K and Boak Patricia L
Bought by
Abn Amro Mortgage Group Inc and Atlantic Mortgage & Investment Corp
Purchase Details
Closed on
Jul 27, 1998
Sold by
Boak William K and Boak Patricia L
Bought by
Boak William K
Create a Home Valuation Report for This Property
The Home Valuation Report is an in-depth analysis detailing your home's value as well as a comparison with similar homes in the area
Home Values in the Area
Average Home Value in this Area
Purchase History
| Date | Buyer | Sale Price | Title Company |
|---|---|---|---|
| Smith Derrick | $77,000 | None Available | |
| Hanna Ehab | $49,907 | None Available | |
| Hud | -- | None Available | |
| Abn Amro Mortgage Group Inc | $2,019 | None Available | |
| Boak William K | -- | -- |
Source: Public Records
Mortgage History
| Date | Status | Borrower | Loan Amount |
|---|---|---|---|
| Open | Smith Derrick | $75,600 |
Source: Public Records
Tax History Compared to Growth
Tax History
| Year | Tax Paid | Tax Assessment Tax Assessment Total Assessment is a certain percentage of the fair market value that is determined by local assessors to be the total taxable value of land and additions on the property. | Land | Improvement |
|---|---|---|---|---|
| 2025 | $2,795 | $74,800 | $23,200 | $51,600 |
| 2024 | $2,795 | $74,800 | $23,200 | $51,600 |
| 2023 | $2,795 | $74,800 | $23,200 | $51,600 |
| 2022 | $2,795 | $74,800 | $23,200 | $51,600 |
| 2021 | $2,795 | $74,800 | $23,200 | $51,600 |
| 2020 | $2,795 | $74,800 | $23,200 | $51,600 |
| 2019 | $2,747 | $74,800 | $23,200 | $51,600 |
| 2018 | $1,931 | $74,800 | $23,200 | $51,600 |
| 2017 | $2,386 | $58,100 | $15,600 | $42,500 |
| 2016 | $2,386 | $58,100 | $15,600 | $42,500 |
| 2015 | $682 | $58,100 | $15,600 | $42,500 |
| 2014 | $1,638 | $58,100 | $15,600 | $42,500 |
Source: Public Records
Map
Nearby Homes