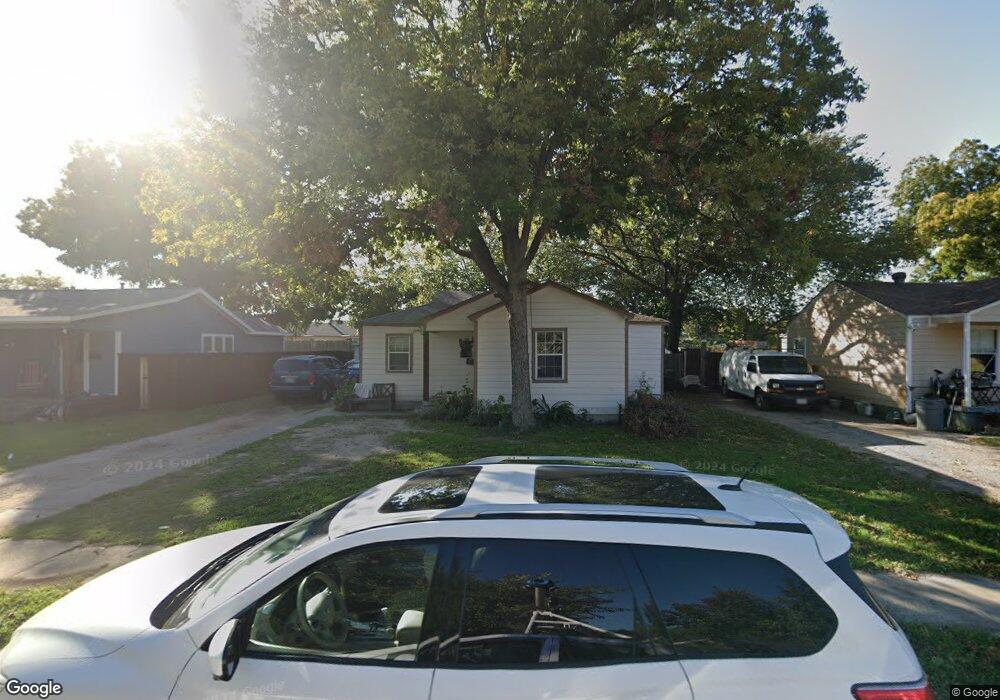
323 NE 10th St Grand Prairie, TX 75050
Estimated Value: $193,736 - $236,000
2
Beds
1
Bath
968
Sq Ft
$219/Sq Ft
Est. Value
About This Home
This home is located at 323 NE 10th St, Grand Prairie, TX 75050 and is currently estimated at $212,434, approximately $219 per square foot. 323 NE 10th St is a home located in Dallas County with nearby schools including Crosswinds High School, James Fannin Middle, and Grand Prairie High School.
Ownership History
Date
Name
Owned For
Owner Type
Purchase Details
Closed on
Mar 13, 2015
Sold by
Cordero Carmen
Bought by
Chacon Maricela Cordero and Araujo Jose Luis
Current Estimated Value
Purchase Details
Closed on
Apr 9, 2004
Sold by
Guerra Alberto Jesus and Guerra Anita Irma
Bought by
Cordero Carmen
Home Financials for this Owner
Home Financials are based on the most recent Mortgage that was taken out on this home.
Original Mortgage
$63,002
Interest Rate
5.42%
Mortgage Type
FHA
Create a Home Valuation Report for This Property
The Home Valuation Report is an in-depth analysis detailing your home's value as well as a comparison with similar homes in the area
Home Values in the Area
Average Home Value in this Area
Purchase History
| Date | Buyer | Sale Price | Title Company |
|---|---|---|---|
| Chacon Maricela Cordero | -- | None Available | |
| Cordero Carmen | -- | Ctic |
Source: Public Records
Mortgage History
| Date | Status | Borrower | Loan Amount |
|---|---|---|---|
| Previous Owner | Cordero Carmen | $63,002 |
Source: Public Records
Tax History Compared to Growth
Tax History
| Year | Tax Paid | Tax Assessment Tax Assessment Total Assessment is a certain percentage of the fair market value that is determined by local assessors to be the total taxable value of land and additions on the property. | Land | Improvement |
|---|---|---|---|---|
| 2025 | $2,717 | $171,460 | $45,000 | $126,460 |
| 2024 | $2,717 | $162,970 | $45,000 | $117,970 |
| 2023 | $2,717 | $172,110 | $40,000 | $132,110 |
| 2022 | $3,189 | $125,720 | $40,000 | $85,720 |
| 2021 | $2,594 | $97,590 | $25,000 | $72,590 |
| 2020 | $2,640 | $93,620 | $25,000 | $68,620 |
| 2019 | $2,232 | $76,400 | $20,000 | $56,400 |
| 2018 | $1,747 | $59,790 | $15,000 | $44,790 |
| 2017 | $1,747 | $59,790 | $15,000 | $44,790 |
| 2016 | $1,328 | $45,480 | $12,000 | $33,480 |
| 2015 | $808 | $40,430 | $10,000 | $30,430 |
| 2014 | $808 | $39,820 | $10,000 | $29,820 |
Source: Public Records
Map
Nearby Homes