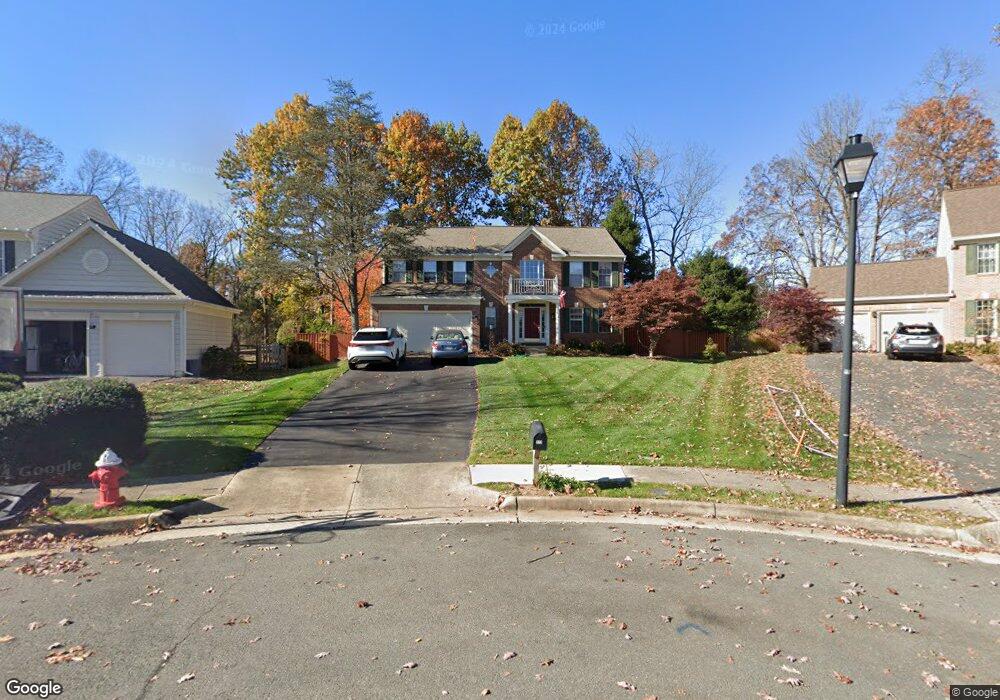
323 Nickels Dr SW Leesburg, VA 20175
Estimated Value: $844,531 - $908,000
4
Beds
4
Baths
2,316
Sq Ft
$376/Sq Ft
Est. Value
About This Home
This home is located at 323 Nickels Dr SW, Leesburg, VA 20175 and is currently estimated at $870,633, approximately $375 per square foot. 323 Nickels Dr SW is a home located in Loudoun County with nearby schools including Catoctin Elementary School, J. Lupton Simpson Middle School, and Loudoun County High School.
Ownership History
Date
Name
Owned For
Owner Type
Purchase Details
Closed on
Jun 10, 2020
Sold by
Levit Ian D and Levit Donna R
Bought by
Levit Ian D and Ian D Levit Trust
Current Estimated Value
Purchase Details
Closed on
Nov 30, 1998
Sold by
Urman Joseph M F
Bought by
Levit Ian D
Home Financials for this Owner
Home Financials are based on the most recent Mortgage that was taken out on this home.
Original Mortgage
$150,000
Outstanding Balance
$34,219
Interest Rate
6.83%
Estimated Equity
$836,414
Purchase Details
Closed on
Aug 22, 1994
Sold by
Trafalgar House Prop
Bought by
Furman Joseph M
Home Financials for this Owner
Home Financials are based on the most recent Mortgage that was taken out on this home.
Original Mortgage
$180,000
Interest Rate
8.61%
Create a Home Valuation Report for This Property
The Home Valuation Report is an in-depth analysis detailing your home's value as well as a comparison with similar homes in the area
Home Values in the Area
Average Home Value in this Area
Purchase History
| Date | Buyer | Sale Price | Title Company |
|---|---|---|---|
| Levit Ian D | -- | None Available | |
| Levit Ian D | $265,000 | -- | |
| Furman Joseph M | $231,500 | -- |
Source: Public Records
Mortgage History
| Date | Status | Borrower | Loan Amount |
|---|---|---|---|
| Open | Levit Ian D | $150,000 | |
| Previous Owner | Furman Joseph M | $180,000 |
Source: Public Records
Tax History Compared to Growth
Tax History
| Year | Tax Paid | Tax Assessment Tax Assessment Total Assessment is a certain percentage of the fair market value that is determined by local assessors to be the total taxable value of land and additions on the property. | Land | Improvement |
|---|---|---|---|---|
| 2025 | $6,590 | $818,620 | $269,900 | $548,720 |
| 2024 | $6,933 | $801,480 | $259,900 | $541,580 |
| 2023 | $6,142 | $701,930 | $249,900 | $452,030 |
| 2022 | $5,935 | $666,850 | $229,900 | $436,950 |
| 2021 | $5,656 | $577,180 | $199,900 | $377,280 |
| 2020 | $5,339 | $515,880 | $179,900 | $335,980 |
| 2019 | $5,235 | $500,920 | $179,900 | $321,020 |
| 2018 | $5,197 | $478,970 | $159,900 | $319,070 |
| 2017 | $5,161 | $458,760 | $159,900 | $298,860 |
| 2016 | $5,155 | $450,220 | $0 | $0 |
| 2015 | $820 | $287,980 | $0 | $287,980 |
| 2014 | $826 | $301,510 | $0 | $301,510 |
Source: Public Records
Map
Nearby Homes
- 1432 Moore Place SW
- 146 Hampshire Square SW
- 131 Goldsworth Terrace SW
- 520 Clagett St SW
- 15 Linden Hill Way SW
- 641 Meade Dr SW
- 227 Stoic St SE
- 1023 Themis St SE
- 125 Clubhouse Dr SW Unit 11
- 1508 Woodlea Dr SW
- 102 Stoic St SE
- 18371 Sydnor Hill Ct
- 18515 Lake Hill Dr
- 714 Donaldson Ln SW
- 18698 Woodburn Rd
- 252 Elia Ct SE
- 709 Pastoral Place SW
- 202 Stratford Place SW
- 428 Foxridge Dr SW
- 18132 Shenstone Run Ct
- 325 Nickels Dr SW
- 321 Nickels Dr SW
- 319 Nickels Dr SW
- 324 Nickels Dr SW
- 320 Nickels Dr SW
- 317 Nickels Dr SW
- 318 Nickels Dr SW
- 1218 Bradfield Dr SW
- 322 Nickels Dr SW
- 1216 Bradfield Dr SW
- 315 Nickels Dr SW
- 316 Nickels Dr SW
- 1214 Bradfield Dr SW
- 313 Nickels Dr SW
- 314 Nickels Dr SW
- 1212 Bradfield Dr SW
- 1222 Bradfield Dr SW
- 311 Nickels Dr SW
- 1215 Bradfield Dr SW
- 1210 Bradfield Dr SW