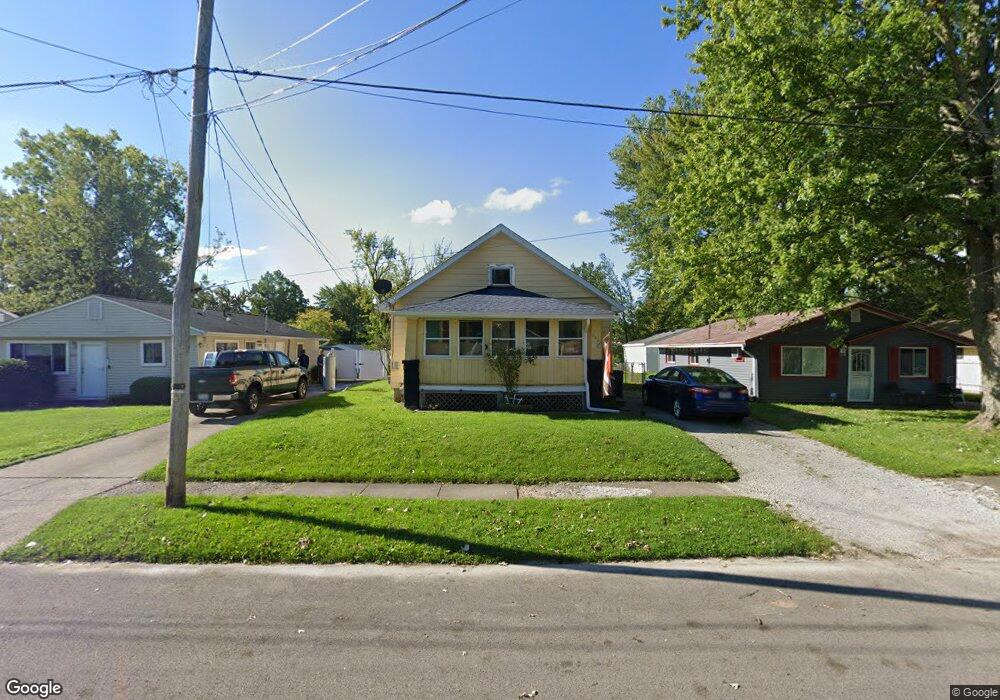
323 Parmely Ave Elyria, OH 44035
Estimated Value: $108,674 - $125,000
3
Beds
1
Bath
864
Sq Ft
$132/Sq Ft
Est. Value
About This Home
This home is located at 323 Parmely Ave, Elyria, OH 44035 and is currently estimated at $113,919, approximately $131 per square foot. 323 Parmely Ave is a home located in Lorain County with nearby schools including Crestwood Elementary School, Westwood Middle School, and Elyria High School.
Ownership History
Date
Name
Owned For
Owner Type
Purchase Details
Closed on
Jan 14, 2005
Sold by
Futrall Doug A
Bought by
Smith Thomas L and Smith Sandy E
Current Estimated Value
Home Financials for this Owner
Home Financials are based on the most recent Mortgage that was taken out on this home.
Original Mortgage
$66,837
Outstanding Balance
$33,923
Interest Rate
5.83%
Mortgage Type
FHA
Estimated Equity
$79,996
Purchase Details
Closed on
Sep 3, 2004
Sold by
Davis Jason E and Davis Gina M
Bought by
Futrall Doug A
Purchase Details
Closed on
May 17, 2004
Sold by
Davis Jason E and Davis Gina
Bought by
Davis Jason E and Futrall Doug A
Purchase Details
Closed on
Apr 21, 2004
Sold by
Citibank Na
Bought by
Davis Jason E
Purchase Details
Closed on
Mar 15, 2004
Sold by
Parsons David G and Parsons Kathleen R
Bought by
Citibank Na
Create a Home Valuation Report for This Property
The Home Valuation Report is an in-depth analysis detailing your home's value as well as a comparison with similar homes in the area
Home Values in the Area
Average Home Value in this Area
Purchase History
| Date | Buyer | Sale Price | Title Company |
|---|---|---|---|
| Smith Thomas L | $67,900 | Real Estate Title | |
| Futrall Doug A | $18,400 | Chicago Title Insurance Co | |
| Davis Jason E | -- | Chicago Title Insurance Co | |
| Davis Jason E | $24,900 | Resource Title Agency Inc | |
| Citibank Na | $57,800 | -- |
Source: Public Records
Mortgage History
| Date | Status | Borrower | Loan Amount |
|---|---|---|---|
| Open | Smith Thomas L | $66,837 |
Source: Public Records
Tax History
| Year | Tax Paid | Tax Assessment Tax Assessment Total Assessment is a certain percentage of the fair market value that is determined by local assessors to be the total taxable value of land and additions on the property. | Land | Improvement |
|---|---|---|---|---|
| 2024 | $1,240 | $25,512 | $4,589 | $20,923 |
| 2023 | $1,099 | $19,422 | $3,136 | $16,286 |
| 2022 | $1,079 | $19,422 | $3,136 | $16,286 |
| 2021 | $1,090 | $19,422 | $3,136 | $16,286 |
| 2020 | $982 | $16,040 | $2,590 | $13,450 |
| 2019 | $975 | $16,040 | $2,590 | $13,450 |
| 2018 | $977 | $16,040 | $2,590 | $13,450 |
| 2017 | $852 | $13,400 | $2,450 | $10,950 |
| 2016 | $840 | $13,400 | $2,450 | $10,950 |
| 2015 | $787 | $13,400 | $2,450 | $10,950 |
| 2014 | $778 | $13,400 | $2,450 | $10,950 |
| 2013 | $770 | $13,400 | $2,450 | $10,950 |
Source: Public Records
Map
Nearby Homes
- 211 Brace Ave
- 142 Parmely Ave
- 77 King St
- 161 High St
- 572 Bell Ave
- 401 Louisiana Ave
- 807 Woodland Ave
- 348 Robin Dr
- 320 Hayes Ave
- 604 Bell Ave
- 0 Lake Ave
- 148 Oak St
- 504 Furnace St
- 950 W River Rd N
- 1028 Foster Ave
- 119 Erie St
- 1201 W River Rd N Unit B3
- 747 W River Rd N
- 1207 W River Rd N Unit D3
- 336 Furnace St
- 319 Parmely Ave
- 325 Parmely Ave
- 327 Parmely Ave
- 315 Parmely Ave
- 331 Parmely Ave
- 320 Brace Ave
- 322 Brace Ave
- 318 Brace Ave
- 326 Brace Ave
- 332 Brace Ave
- 320 Parmely Ave
- 333 Parmely Ave
- 324 Parmely Ave
- 312 Parmely Ave
- 328 Parmely Ave
- 337 Parmely Ave
- 308 Parmely Ave
- 1115 Adams St
- 332 Parmely Ave
- 304 Parmely Ave
Your Personal Tour Guide
Ask me questions while you tour the home.