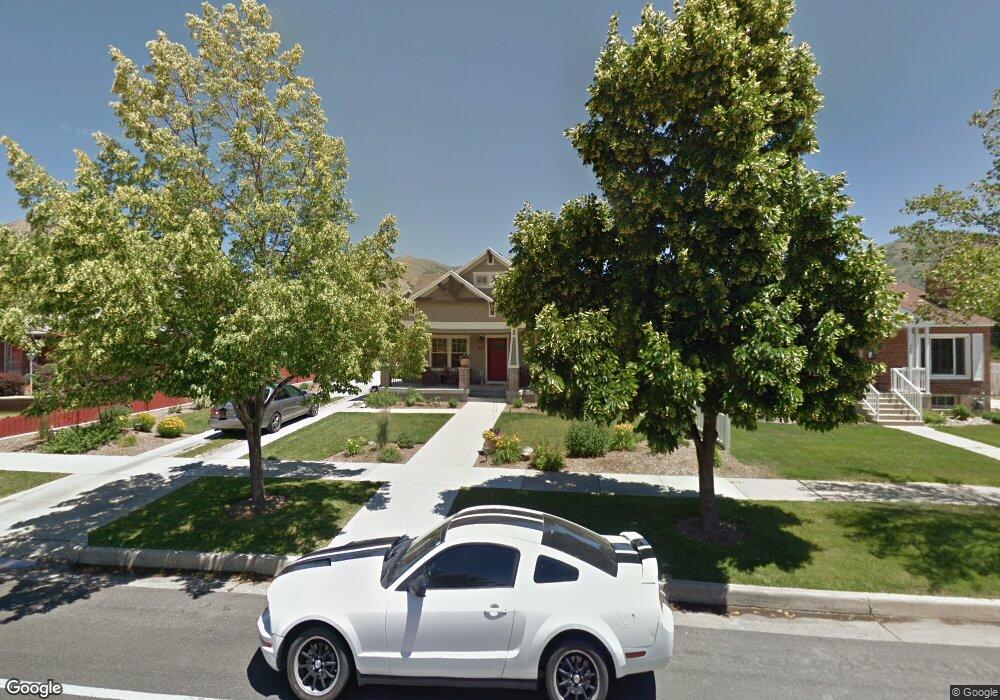
323 S 200 E Brigham City, UT 84302
Estimated Value: $464,000 - $531,000
3
Beds
--
Bath
1,816
Sq Ft
$271/Sq Ft
Est. Value
About This Home
This home is located at 323 S 200 E, Brigham City, UT 84302 and is currently estimated at $492,040, approximately $270 per square foot. 323 S 200 E is a home with nearby schools including Golden Spike Elementary, Box Elder Middle School, and Adele C. Young Intermediate School.
Ownership History
Date
Name
Owned For
Owner Type
Purchase Details
Closed on
Sep 24, 2019
Sold by
Grover Rick V and Grover Maureen K
Bought by
Grover Ricky V and Grover Maureen K
Current Estimated Value
Purchase Details
Closed on
Apr 1, 2010
Sold by
Jones Albert Wayne and Jones Loretta J
Bought by
Grover Rick and Grover Maureen K
Purchase Details
Closed on
Sep 19, 2007
Sold by
Hansen Neil
Bought by
The Albert Wayne Jones And Lorett J Jone
Create a Home Valuation Report for This Property
The Home Valuation Report is an in-depth analysis detailing your home's value as well as a comparison with similar homes in the area
Purchase History
| Date | Buyer | Sale Price | Title Company |
|---|---|---|---|
| Grover Ricky V | -- | None Available | |
| Grover Rick | -- | -- | |
| The Albert Wayne Jones And Lorett J Jone | -- | First American Title Company |
Source: Public Records
Tax History
| Year | Tax Paid | Tax Assessment Tax Assessment Total Assessment is a certain percentage of the fair market value that is determined by local assessors to be the total taxable value of land and additions on the property. | Land | Improvement |
|---|---|---|---|---|
| 2025 | $2,903 | $499,261 | $105,000 | $394,261 |
| 2024 | $2,591 | $498,773 | $100,000 | $398,773 |
| 2023 | $2,750 | $542,062 | $95,000 | $447,062 |
| 2022 | $2,769 | $279,085 | $22,000 | $257,085 |
| 2021 | $2,277 | $361,663 | $40,000 | $321,663 |
| 2020 | $2,226 | $361,663 | $40,000 | $321,663 |
| 2019 | $2,065 | $178,561 | $22,000 | $156,561 |
| 2018 | $1,840 | $158,140 | $22,000 | $136,140 |
| 2017 | $1,824 | $271,403 | $18,810 | $237,203 |
| 2016 | $1,901 | $143,059 | $18,810 | $124,249 |
| 2015 | $1,744 | $131,764 | $18,810 | $112,954 |
| 2014 | $1,744 | $126,385 | $18,810 | $107,575 |
| 2013 | -- | $126,385 | $18,810 | $107,575 |
Source: Public Records
Map
Nearby Homes
Your Personal Tour Guide
Ask me questions while you tour the home.