Estimated Value: $81,000 - $154,000
3
Beds
1
Bath
1,466
Sq Ft
$86/Sq Ft
Est. Value
About This Home
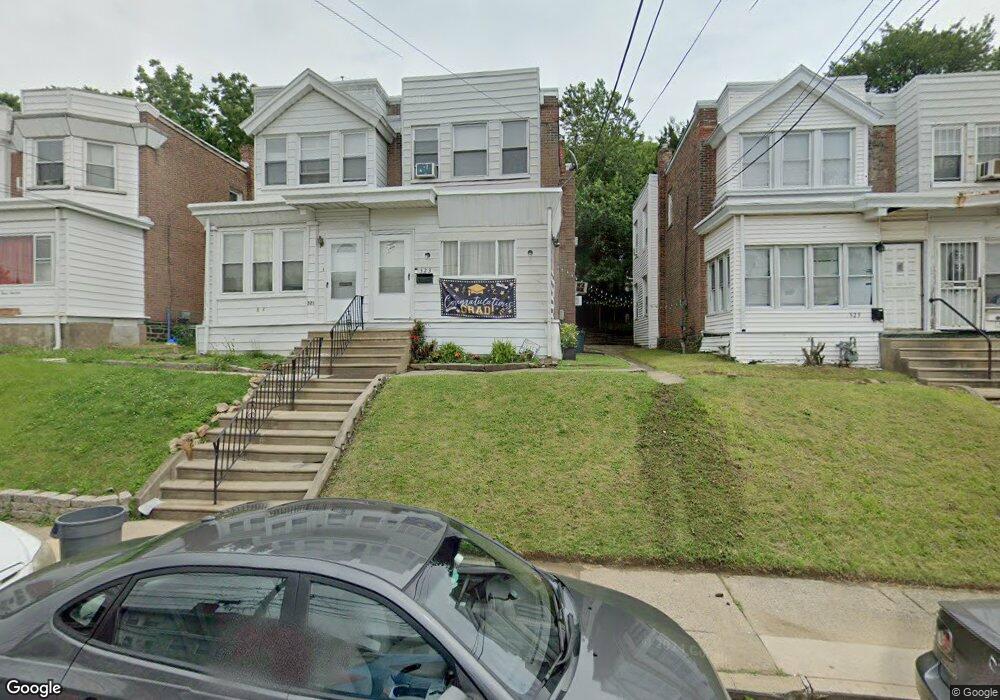
This home is located at 323 S 7th St, Darby, PA 19023 and is currently estimated at $125,730, approximately $85 per square foot. 323 S 7th St is a home located in Delaware County with nearby schools including Walnut Street Elementary School, Penn Wood Middle School, and Penn Wood High School - Cypress Street Campus.
Ownership History
Date
Name
Owned For
Owner Type
Purchase Details
Closed on
Nov 1, 2007
Sold by
Deutsche Bank Trust Co Americas
Bought by
Red Spike Properties
Current Estimated Value
Purchase Details
Closed on
Jul 16, 2007
Sold by
Williams Lanisha and Bankers Trust Co
Bought by
Deutsche Bank Trust Co Americas and Bankers Trust Co
Purchase Details
Closed on
Sep 13, 2000
Sold by
Crooks Kevin P and Crooks Debra A
Bought by
Williams Lainisha
Home Financials for this Owner
Home Financials are based on the most recent Mortgage that was taken out on this home.
Original Mortgage
$44,800
Interest Rate
12.87%
Mortgage Type
Purchase Money Mortgage
Create a Home Valuation Report for This Property
The Home Valuation Report is an in-depth analysis detailing your home's value as well as a comparison with similar homes in the area
Home Values in the Area
Average Home Value in this Area
Purchase History
| Date | Buyer | Sale Price | Title Company |
|---|---|---|---|
| Red Spike Properties | $41,000 | None Available | |
| Deutsche Bank Trust Co Americas | $1,347 | None Available | |
| Williams Lainisha | $56,000 | -- |
Source: Public Records
Mortgage History
| Date | Status | Borrower | Loan Amount |
|---|---|---|---|
| Previous Owner | Williams Lainisha | $44,800 | |
| Closed | Williams Lainisha | $8,400 |
Source: Public Records
Tax History
| Year | Tax Paid | Tax Assessment Tax Assessment Total Assessment is a certain percentage of the fair market value that is determined by local assessors to be the total taxable value of land and additions on the property. | Land | Improvement |
|---|---|---|---|---|
| 2025 | $2,971 | $60,000 | $14,000 | $46,000 |
| 2024 | $2,971 | $60,000 | $14,000 | $46,000 |
| 2023 | $2,795 | $60,000 | $14,000 | $46,000 |
| 2022 | $2,965 | $65,420 | $14,620 | $50,800 |
| 2021 | $4,137 | $65,420 | $14,620 | $50,800 |
| 2020 | $2,433 | $33,300 | $13,860 | $19,440 |
| 2019 | $2,329 | $33,300 | $13,860 | $19,440 |
| 2018 | $2,301 | $33,300 | $0 | $0 |
| 2017 | $2,259 | $33,300 | $0 | $0 |
| 2016 | $186 | $33,300 | $0 | $0 |
| 2015 | $186 | $33,300 | $0 | $0 |
| 2014 | $183 | $33,300 | $0 | $0 |
Source: Public Records
Map
Nearby Homes
Your Personal Tour Guide
Ask me questions while you tour the home.