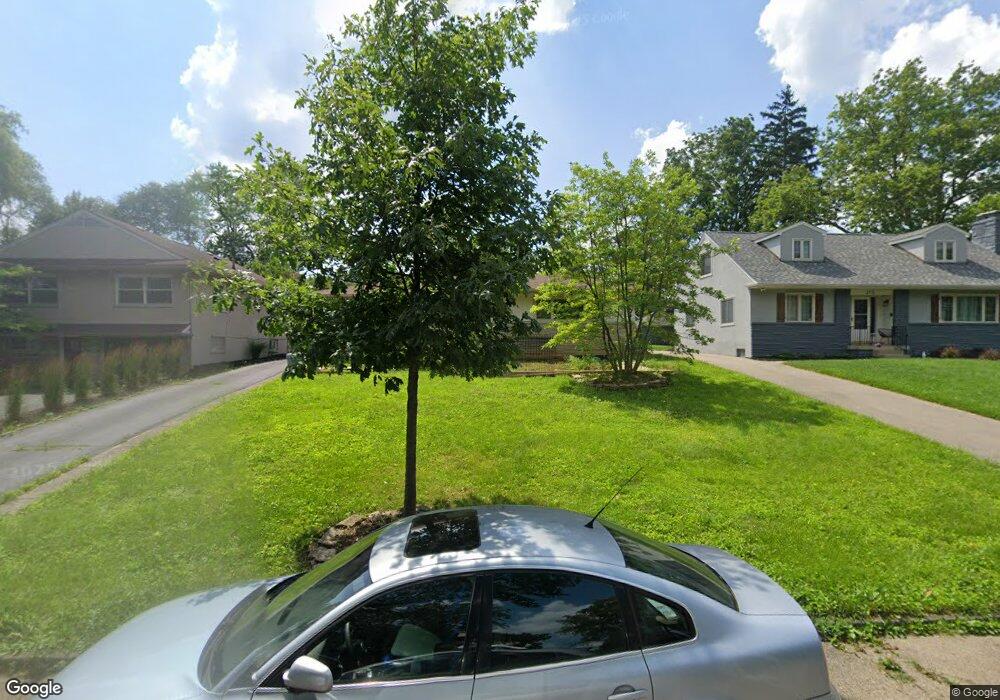
323 S Kellner Rd Columbus, OH 43209
Eastmoor NeighborhoodEstimated Value: $331,000 - $452,000
3
Beds
2
Baths
1,852
Sq Ft
$222/Sq Ft
Est. Value
About This Home
This home is located at 323 S Kellner Rd, Columbus, OH 43209 and is currently estimated at $411,972, approximately $222 per square foot. 323 S Kellner Rd is a home located in Franklin County with nearby schools including Fairmoor Elementary School, Johnson Park Middle School, and Walnut Ridge High School.
Ownership History
Date
Name
Owned For
Owner Type
Purchase Details
Closed on
Dec 14, 2014
Sold by
Kofman Jenny
Bought by
Kofman Stanislav
Current Estimated Value
Home Financials for this Owner
Home Financials are based on the most recent Mortgage that was taken out on this home.
Original Mortgage
$100,450
Outstanding Balance
$34,713
Interest Rate
3.95%
Mortgage Type
Purchase Money Mortgage
Estimated Equity
$377,259
Purchase Details
Closed on
Jan 31, 2006
Sold by
Kofman Stanislav and Kofman Eleonora
Bought by
Kofman Stanislav and Kofman Jenny
Home Financials for this Owner
Home Financials are based on the most recent Mortgage that was taken out on this home.
Original Mortgage
$120,000
Interest Rate
6.37%
Mortgage Type
Purchase Money Mortgage
Purchase Details
Closed on
Jan 18, 1990
Bought by
Lyman Alberta B
Purchase Details
Closed on
Aug 1, 1986
Purchase Details
Closed on
Apr 1, 1986
Create a Home Valuation Report for This Property
The Home Valuation Report is an in-depth analysis detailing your home's value as well as a comparison with similar homes in the area
Home Values in the Area
Average Home Value in this Area
Purchase History
| Date | Buyer | Sale Price | Title Company |
|---|---|---|---|
| Kofman Stanislav | -- | None Available | |
| Kofman Stanislav | -- | Trinity Tit | |
| Kofman Stanislav | $155,000 | Trinity Tit | |
| Lyman Alberta B | -- | -- | |
| -- | $85,500 | -- | |
| -- | $68,000 | -- |
Source: Public Records
Mortgage History
| Date | Status | Borrower | Loan Amount |
|---|---|---|---|
| Open | Kofman Stanislav | $100,450 | |
| Closed | Kofman Stanislav | $120,000 |
Source: Public Records
Tax History Compared to Growth
Tax History
| Year | Tax Paid | Tax Assessment Tax Assessment Total Assessment is a certain percentage of the fair market value that is determined by local assessors to be the total taxable value of land and additions on the property. | Land | Improvement |
|---|---|---|---|---|
| 2024 | $5,050 | $122,330 | $43,230 | $79,100 |
| 2023 | $5,014 | $122,325 | $43,225 | $79,100 |
| 2022 | $4,103 | $87,860 | $27,900 | $59,960 |
| 2021 | $4,565 | $87,860 | $27,900 | $59,960 |
| 2020 | $4,571 | $87,860 | $27,900 | $59,960 |
| 2019 | $4,270 | $70,390 | $22,330 | $48,060 |
| 2018 | $3,837 | $70,390 | $22,330 | $48,060 |
| 2017 | $4,268 | $70,390 | $22,330 | $48,060 |
| 2016 | $3,759 | $56,740 | $17,220 | $39,520 |
| 2015 | $3,412 | $56,740 | $17,220 | $39,520 |
| 2014 | $3,420 | $56,740 | $17,220 | $39,520 |
| 2013 | $1,687 | $56,735 | $17,220 | $39,515 |
Source: Public Records
Map
Nearby Homes
- 297 S James Rd
- 277 S James Rd
- 247 S James Rd
- 430 S James Rd
- 3160 Fair Ave
- 560 S Kellner Rd
- 565 S Kellner Rd
- 50 S Chesterfield Rd
- 142 S Gould Rd
- 184 S Hampton Rd
- 123 S Gould Rd
- 618 Eastmoor Blvd
- 616 Eastmoor Blvd Unit 478
- 635 Elizabeth Ave
- 201 S Weyant Ave
- 633 Eastmoor Blvd
- 47 N Chesterfield Rd
- 523 S Napoleon Ave
- 178 S Weyant Ave
- 50 N Broadleigh Rd
- 333 S Kellner Rd
- 305 S Kellner Rd
- 316 Eastmoor Blvd
- 308 Eastmoor Blvd
- 324 Eastmoor Blvd
- 299 S Kellner Rd
- 320 S Kellner Rd
- 300 Eastmoor Blvd
- 332 S Kellner Rd
- 340 S Kellner Rd
- 310 S Kellner Rd
- 306 S Kellner Rd
- 290 Eastmoor Blvd
- 302 S Kellner Rd
- 363 S Kellner Rd
- 283 S Kellner Rd
- 3124 Dale Ave
- 358 S Kellner Rd
- 350 Eastmoor Blvd
- 280 Eastmoor Blvd