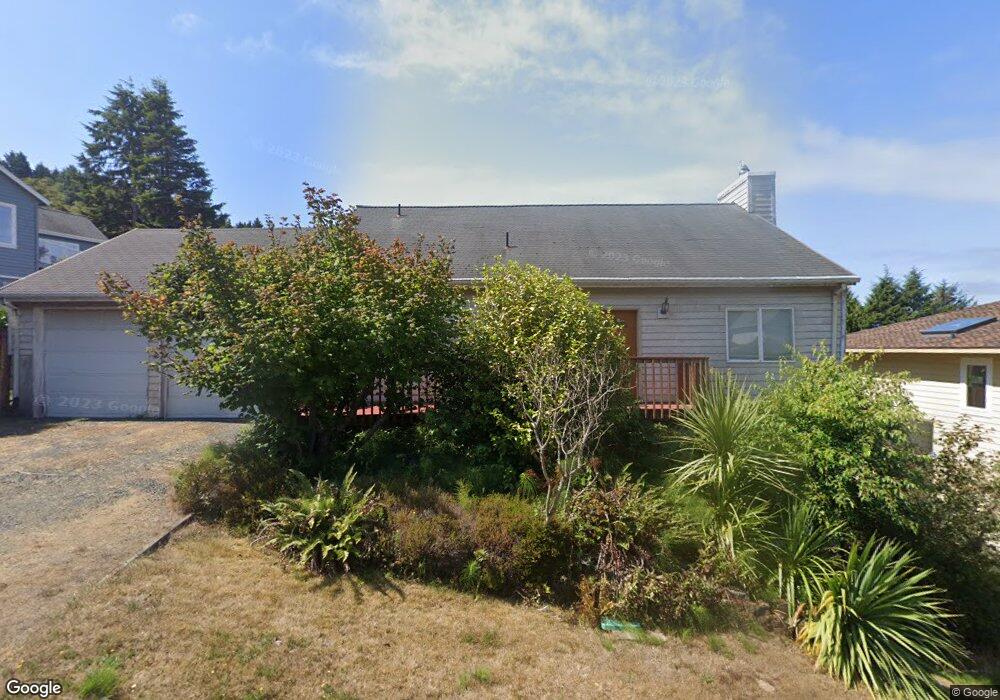
323 S Quadrant St Rockaway Beach, OR 97136
Estimated Value: $674,303 - $782,000
4
Beds
3
Baths
2,800
Sq Ft
$264/Sq Ft
Est. Value
About This Home
This home is located at 323 S Quadrant St, Rockaway Beach, OR 97136 and is currently estimated at $740,101, approximately $264 per square foot. 323 S Quadrant St is a home located in Tillamook County with nearby schools including Garibaldi Elementary School, Nehalem Elementary School, and Neah-Kah-Nie Middle School.
Ownership History
Date
Name
Owned For
Owner Type
Purchase Details
Closed on
Mar 29, 2024
Sold by
Sianaki Mohammad and Sianaki Nahid
Bought by
Sianaki Family Trust and Sianaki
Current Estimated Value
Purchase Details
Closed on
Jan 11, 2013
Sold by
Federal National Mortgage Association
Bought by
Sianaki Mohammad and Sianaki Nahid
Purchase Details
Closed on
May 22, 2012
Sold by
Carter Thomas F
Bought by
Federal National Mortgage Association
Purchase Details
Closed on
Apr 14, 2011
Sold by
Carter Thomas F and Carter Cassie R
Bought by
Carter Thomas F
Home Financials for this Owner
Home Financials are based on the most recent Mortgage that was taken out on this home.
Original Mortgage
$353,150
Interest Rate
4.63%
Mortgage Type
New Conventional
Purchase Details
Closed on
Mar 23, 2005
Sold by
Showell Gary and Showell Beverly J
Bought by
Carter Thomas F and Carter Cassie R
Home Financials for this Owner
Home Financials are based on the most recent Mortgage that was taken out on this home.
Original Mortgage
$275,000
Interest Rate
5.53%
Mortgage Type
Fannie Mae Freddie Mac
Create a Home Valuation Report for This Property
The Home Valuation Report is an in-depth analysis detailing your home's value as well as a comparison with similar homes in the area
Home Values in the Area
Average Home Value in this Area
Purchase History
| Date | Buyer | Sale Price | Title Company |
|---|---|---|---|
| Sianaki Family Trust | -- | None Listed On Document | |
| Sianaki Mohammad | $162,225 | Service Link | |
| Federal National Mortgage Association | $383,184 | None Available | |
| Carter Thomas F | -- | First American Title | |
| Carter Thomas F | $275,000 | Ticor Title Ins Co |
Source: Public Records
Mortgage History
| Date | Status | Borrower | Loan Amount |
|---|---|---|---|
| Previous Owner | Carter Thomas F | $353,150 | |
| Previous Owner | Carter Thomas F | $275,000 |
Source: Public Records
Tax History Compared to Growth
Tax History
| Year | Tax Paid | Tax Assessment Tax Assessment Total Assessment is a certain percentage of the fair market value that is determined by local assessors to be the total taxable value of land and additions on the property. | Land | Improvement |
|---|---|---|---|---|
| 2024 | $3,329 | $344,640 | $59,610 | $285,030 |
| 2023 | $3,315 | $334,610 | $57,870 | $276,740 |
| 2022 | $3,211 | $324,870 | $56,180 | $268,690 |
| 2021 | $3,112 | $315,410 | $54,540 | $260,870 |
| 2020 | $3,024 | $306,230 | $52,940 | $253,290 |
| 2019 | $2,931 | $296,440 | $56,360 | $240,080 |
| 2018 | $2,776 | $279,700 | $53,320 | $226,380 |
| 2017 | $2,661 | $267,830 | $54,080 | $213,750 |
| 2016 | $2,814 | $283,220 | $54,080 | $229,140 |
| 2015 | $2,430 | $241,290 | $55,660 | $185,630 |
| 2014 | $2,013 | $196,720 | $55,660 | $141,060 |
| 2013 | -- | $309,070 | $64,260 | $244,810 |
Source: Public Records
Map
Nearby Homes
- 302 S Quadrant St
- 215 S Neptune St
- 186 S Neptune St
- 0 St
- 0 S Longview Loop Unit 23324548
- 461 Terrace Dr
- 101 S Quadrant St
- 240 S Harbor St
- 367 S Longview Loop
- 126 N Ocean Ave
- 155 N Ocean Loop
- Lot 57 Pacific View Dr Unit TL3700
- 535 Kesterson Ct
- 0 S 2nd Ave
- 02400 Pacific View Estates
- TL #02400 Pacific View Estates
- 333 Pacific View Dr
- 126 N Harbor St
- 313 S Quadrant St
- 335 S Quadrant St
- 318 S Quadrant St
- 330 S Quadrant St
- 0 S Palisade St Unit 5-104279
- 0 S Palisade St Unit 113 21662548
- 0 S Palisade St Unit 1
- 0 Vl 801 & 803 South Palisade St Unit 22-60
- 310 S Quadrant St
- 0 S Quadrant St Unit 5-102274
- 0 S Quadrant St Unit 5-102281
- 0 S Quadrant St Unit 6-388
- 0 S Quadrant St Unit 14-566
- 0 S Quadrant St Unit 5-104771
- 0 S Quadrant St Unit 5-82173
- 0 S Quadrant St Unit 5-82175
- 0 S Quadrant St Unit 22118006
- 0 S Quadrant St Unit 22669454
- 0 S Quadrant St Unit 14011323
- 0 S Quadrant St Unit 14228988