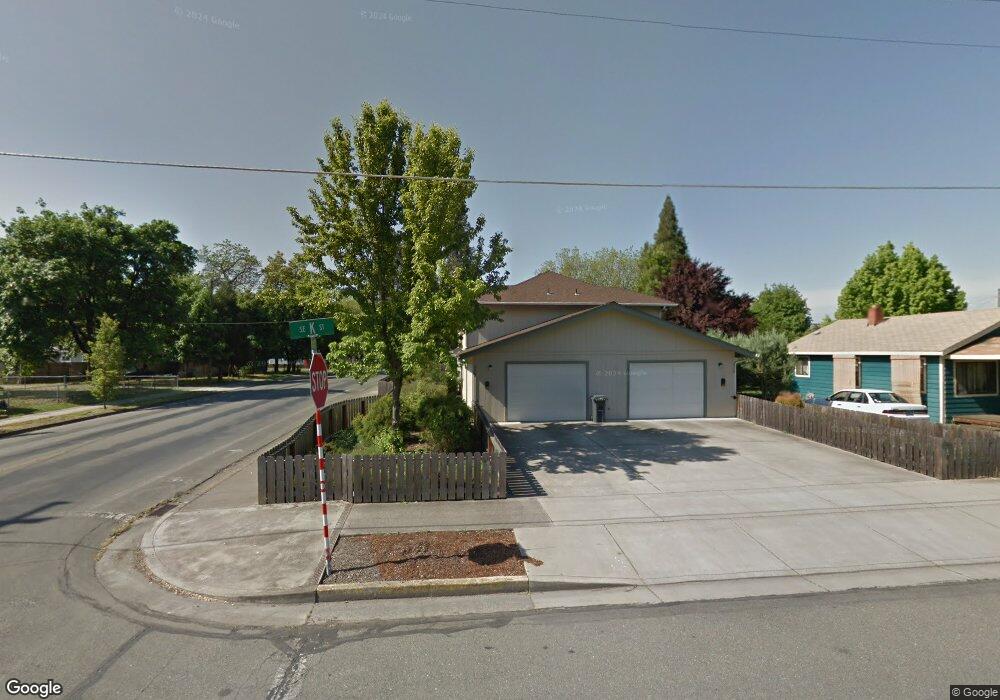
323 SE K St Grants Pass, OR 97526
Estimated Value: $443,538 - $458,000
4
Beds
4
Baths
2,546
Sq Ft
$177/Sq Ft
Est. Value
About This Home
This home is located at 323 SE K St, Grants Pass, OR 97526 and is currently estimated at $450,769, approximately $177 per square foot. 323 SE K St is a home located in Josephine County with nearby schools including Riverside Elementary School, South Middle School, and Grants Pass High School.
Ownership History
Date
Name
Owned For
Owner Type
Purchase Details
Closed on
Jun 5, 2025
Sold by
Happel Thomas J
Bought by
Happel Family Trust and Happel
Current Estimated Value
Purchase Details
Closed on
Dec 15, 2021
Sold by
Shingle Robert E and Shingle Leslie S
Bought by
Happel Georganna
Home Financials for this Owner
Home Financials are based on the most recent Mortgage that was taken out on this home.
Original Mortgage
$145,000
Interest Rate
3.09%
Mortgage Type
New Conventional
Purchase Details
Closed on
Dec 20, 2011
Sold by
David Charles Michael and David Janet Lee
Bought by
Shingle Robert E and Shingle Leslie S
Purchase Details
Closed on
Jan 23, 2009
Sold by
Lee David Charles Michael and Lee David Janet
Bought by
Lee David Charles Michael and Lee David Janet
Create a Home Valuation Report for This Property
The Home Valuation Report is an in-depth analysis detailing your home's value as well as a comparison with similar homes in the area
Home Values in the Area
Average Home Value in this Area
Purchase History
| Date | Buyer | Sale Price | Title Company |
|---|---|---|---|
| Happel Family Trust | -- | None Listed On Document | |
| Happel Georganna | $450,000 | Ticor Title | |
| Shingle Robert E | $175,000 | Ticor Title Company Oregon | |
| Lee David Charles Michael | -- | None Available |
Source: Public Records
Mortgage History
| Date | Status | Borrower | Loan Amount |
|---|---|---|---|
| Previous Owner | Happel Georganna | $145,000 |
Source: Public Records
Tax History Compared to Growth
Tax History
| Year | Tax Paid | Tax Assessment Tax Assessment Total Assessment is a certain percentage of the fair market value that is determined by local assessors to be the total taxable value of land and additions on the property. | Land | Improvement |
|---|---|---|---|---|
| 2025 | $3,497 | $269,300 | -- | -- |
| 2024 | $3,497 | $261,460 | -- | -- |
| 2023 | $3,294 | $253,850 | $0 | $0 |
| 2022 | $3,310 | $246,460 | -- | -- |
| 2021 | $3,109 | $239,290 | $0 | $0 |
| 2020 | $3,019 | $232,330 | $0 | $0 |
| 2019 | $2,932 | $225,570 | $0 | $0 |
| 2018 | $2,983 | $219,000 | $0 | $0 |
| 2017 | $2,961 | $212,630 | $0 | $0 |
| 2016 | $2,592 | $206,440 | $0 | $0 |
| 2015 | $2,518 | $200,430 | $0 | $0 |
| 2014 | $2,449 | $194,600 | $0 | $0 |
Source: Public Records
Map
Nearby Homes
- 409 SE J St
- 415 SE J St
- 702 SE 9th St
- 710 SE 12th St
- 711 SE Riverside Ave
- 619 SE M St
- 139 SW I St
- 737 SE M St
- 303 SW I St
- 330 SW K St
- 414 SW I St
- 861 SE M St
- 115 Rogue River Hwy Unit 302
- 115 Rogue River Hwy Unit 307
- 1288 Tobin Ct
- 708 SW Bridge St
- 253 SW Central Ave
- 1331 Vista Dr
- 419 NW D St
- 811 NE Clyde Place