323 Stuart Rd Unit 1 Lockport, IL 60441
Estimated Value: $241,467 - $295,000
Studio
--
Bath
1,232
Sq Ft
$213/Sq Ft
Est. Value
About This Home
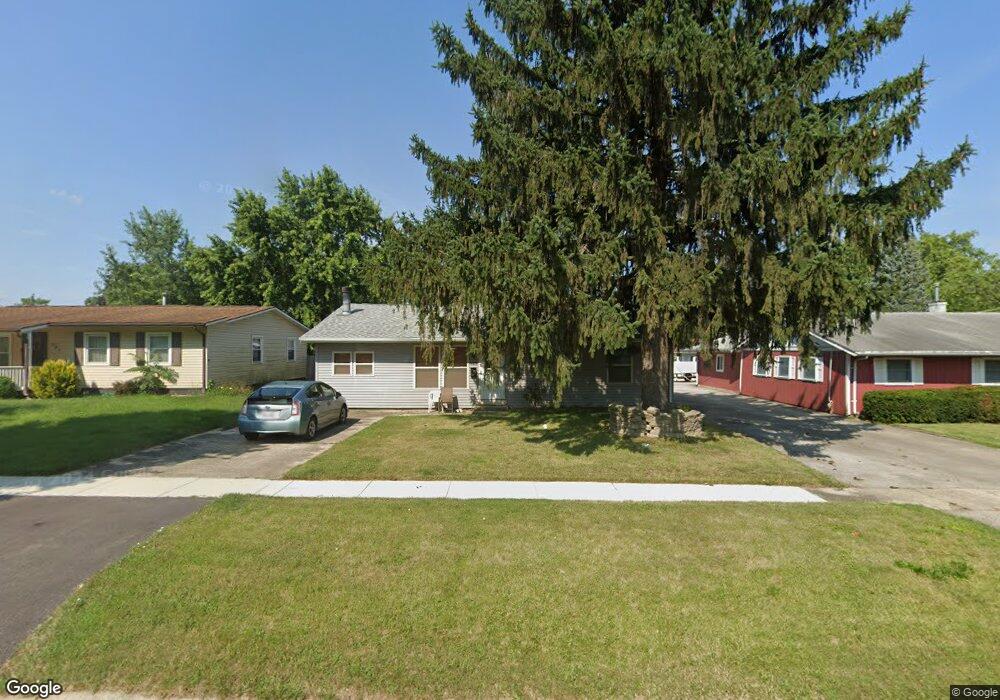
This home is located at 323 Stuart Rd Unit 1, Lockport, IL 60441 and is currently estimated at $262,117, approximately $212 per square foot. 323 Stuart Rd Unit 1 is a home located in Will County with nearby schools including Walsh Elementary School, Ludwig Elementary School, and Reed Elementary School.
Ownership History
Date
Name
Owned For
Owner Type
Purchase Details
Closed on
Jul 13, 2007
Sold by
Kudzin Leon
Bought by
Kudzin Peter K
Current Estimated Value
Purchase Details
Closed on
Mar 8, 2006
Sold by
Bolin Jay
Bought by
Kudzin Leon
Purchase Details
Closed on
Feb 24, 2006
Sold by
Bolin Stephanie
Bought by
Bolin Jay
Purchase Details
Closed on
Feb 16, 1994
Sold by
Yates Donald R and Cochran Christine
Bought by
Long Michele K
Home Financials for this Owner
Home Financials are based on the most recent Mortgage that was taken out on this home.
Original Mortgage
$80,100
Interest Rate
7.1%
Purchase Details
Closed on
Oct 29, 1909
Sold by
Heisner Michele K and Long Michele K
Bought by
Bolin Jay A and Bolin Stephanie L
Home Financials for this Owner
Home Financials are based on the most recent Mortgage that was taken out on this home.
Original Mortgage
$90,000
Interest Rate
7.87%
Create a Home Valuation Report for This Property
The Home Valuation Report is an in-depth analysis detailing your home's value as well as a comparison with similar homes in the area
Home Values in the Area
Average Home Value in this Area
Purchase History
| Date | Buyer | Sale Price | Title Company |
|---|---|---|---|
| Kudzin Peter K | -- | None Available | |
| Kudzin Leon | -- | None Available | |
| Bolin Jay | -- | None Available | |
| Long Michele K | $89,000 | Chicago Title Insurance Co | |
| Bolin Jay A | $100,000 | -- |
Source: Public Records
Mortgage History
| Date | Status | Borrower | Loan Amount |
|---|---|---|---|
| Previous Owner | Long Michele K | $80,100 | |
| Previous Owner | Bolin Jay A | $90,000 |
Source: Public Records
Tax History
| Year | Tax Paid | Tax Assessment Tax Assessment Total Assessment is a certain percentage of the fair market value that is determined by local assessors to be the total taxable value of land and additions on the property. | Land | Improvement |
|---|---|---|---|---|
| 2024 | $5,581 | $80,556 | $26,197 | $54,359 |
| 2023 | $5,581 | $72,319 | $23,518 | $48,801 |
| 2022 | $4,819 | $65,525 | $21,937 | $43,588 |
| 2021 | $4,511 | $61,578 | $20,616 | $40,962 |
| 2020 | $4,386 | $59,553 | $19,938 | $39,615 |
| 2019 | $4,121 | $56,449 | $18,899 | $37,550 |
| 2018 | $3,647 | $49,748 | $17,821 | $31,927 |
| 2017 | $3,460 | $46,963 | $16,823 | $30,140 |
| 2016 | $3,261 | $44,014 | $15,767 | $28,247 |
| 2015 | $2,655 | $38,776 | $13,891 | $24,885 |
| 2014 | $2,655 | $35,904 | $12,862 | $23,042 |
| 2013 | $2,655 | $36,636 | $13,124 | $23,512 |
Source: Public Records
Map
Nearby Homes
- 310 Mccameron Ave
- 936 Treeline Ct Unit 5B
- 927 Treeline Ct Unit A
- 805 Maryknoll Dr
- 629 Thornton St
- 1330 Lacoma Ct
- 904 Cove Ave
- 514 N Lockwood Dr
- 417 Thornton St
- 16740 W Saddlewood Dr
- 1041 Ashley Ct S Unit 2D
- 134 S Jefferson St
- 0 151st & MacGregor St Unit MRD11873272
- 0 Smith Rd South of 135th St Unit MRD12274096
- 0 N State St Unit 10995892
- 15303 S Oak Run Ct
- 118 N State St
- 1336 Tralee Ln
- 120 N State St
- 107 S State St
- 321 Stuart Rd
- 325 Stuart Rd
- 318 Macintyre St
- 319 Stuart Rd
- 1015 Mccameron Ave
- 1015 Mc Cameron Ave
- 316 Macintyre St
- 1019 Mccameron Ave Unit 1
- 1019 Mccameron Ave Unit 2
- 320 Macintyre St
- 317 Stuart Rd
- 322 Stuart Rd
- 314 Macintyre St Unit 1
- 326 Stuart Rd
- 320 Stuart Rd Unit 1
- 315 Stuart Rd
- 312 Macintyre St Unit 1
- 328 Stuart Rd
- 318 Stuart Rd
- 316 Stuart Rd
Your Personal Tour Guide
Ask me questions while you tour the home.