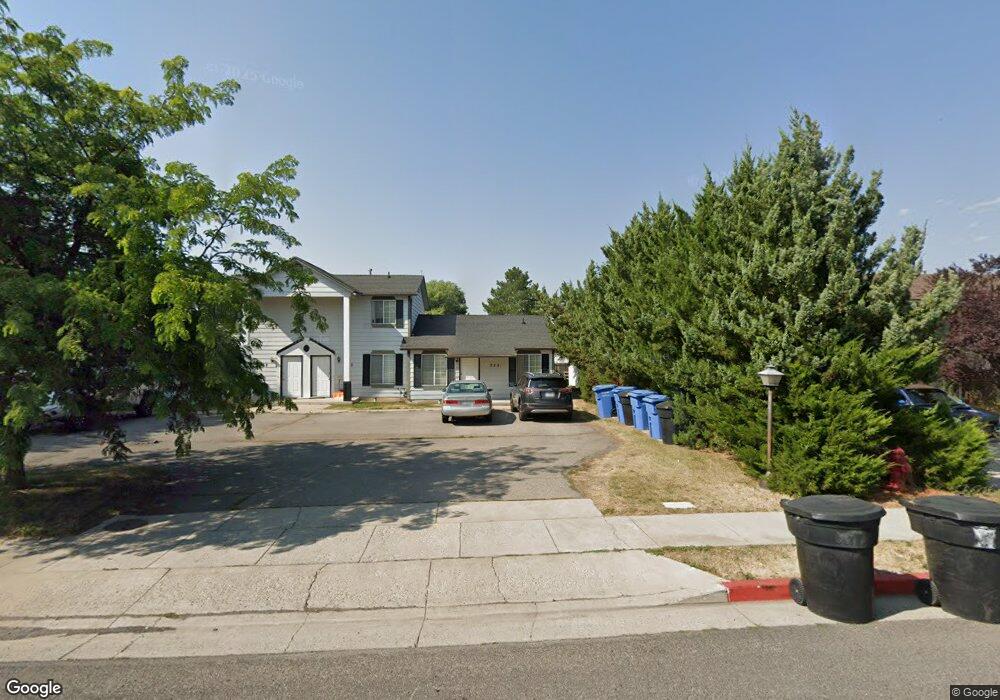
323 W 1050 N Logan, UT 84341
Bridger NeighborhoodEstimated Value: $702,000 - $775,000
8
Beds
4
Baths
3,500
Sq Ft
$210/Sq Ft
Est. Value
About This Home
This home is located at 323 W 1050 N, Logan, UT 84341 and is currently estimated at $733,333, approximately $209 per square foot. 323 W 1050 N is a home located in Cache County with nearby schools including Bridger School, Mount Logan Middle School, and Logan High School.
Ownership History
Date
Name
Owned For
Owner Type
Purchase Details
Closed on
Dec 20, 2021
Sold by
Rogers Tyler Jeremy
Bought by
Maity Properties Llc
Current Estimated Value
Purchase Details
Closed on
Feb 14, 2011
Sold by
Maity Properties Llc
Bought by
Rogers Tyler Jeremy
Purchase Details
Closed on
Mar 18, 2008
Sold by
Rogers Maile Anne and Rogers Tyler
Bought by
Maity Properties Llc
Purchase Details
Closed on
Jan 5, 2005
Sold by
Huber Paul E and Huber Shirlene L
Bought by
Steele Robert F and Steele Marilyn D
Home Financials for this Owner
Home Financials are based on the most recent Mortgage that was taken out on this home.
Original Mortgage
$148,000
Interest Rate
5.7%
Mortgage Type
New Conventional
Create a Home Valuation Report for This Property
The Home Valuation Report is an in-depth analysis detailing your home's value as well as a comparison with similar homes in the area
Home Values in the Area
Average Home Value in this Area
Purchase History
| Date | Buyer | Sale Price | Title Company |
|---|---|---|---|
| Maity Properties Llc | -- | Hickman Land Title Logan | |
| Rogers Tyler Jeremy | -- | Accommodation | |
| Maity Properties Llc | -- | Accommodation | |
| Steele Robert F | -- | Pinnacle Title |
Source: Public Records
Mortgage History
| Date | Status | Borrower | Loan Amount |
|---|---|---|---|
| Previous Owner | Steele Robert F | $148,000 |
Source: Public Records
Tax History Compared to Growth
Tax History
| Year | Tax Paid | Tax Assessment Tax Assessment Total Assessment is a certain percentage of the fair market value that is determined by local assessors to be the total taxable value of land and additions on the property. | Land | Improvement |
|---|---|---|---|---|
| 2025 | $2,776 | $652,700 | $219,300 | $433,400 |
| 2024 | $2,866 | $652,700 | $219,300 | $433,400 |
| 2023 | $2,987 | $648,400 | $215,000 | $433,400 |
| 2022 | $2,791 | $565,800 | $132,400 | $433,400 |
| 2021 | $3,056 | $526,400 | $132,400 | $394,000 |
| 2020 | $2,332 | $361,600 | $90,000 | $271,600 |
| 2019 | $2,438 | $361,600 | $90,000 | $271,600 |
| 2018 | $2,058 | $278,768 | $70,000 | $208,768 |
| 2017 | $1,931 | $138,270 | $0 | $0 |
| 2016 | $2,002 | $138,270 | $0 | $0 |
| 2015 | $2,004 | $138,270 | $0 | $0 |
| 2014 | $1,812 | $138,270 | $0 | $0 |
| 2013 | -- | $125,005 | $0 | $0 |
Source: Public Records
Map
Nearby Homes