323 W 9th St Hazleton, PA 18201
Estimated Value: $141,560 - $280,000
Studio
--
Bath
2,460
Sq Ft
$84/Sq Ft
Est. Value
About This Home
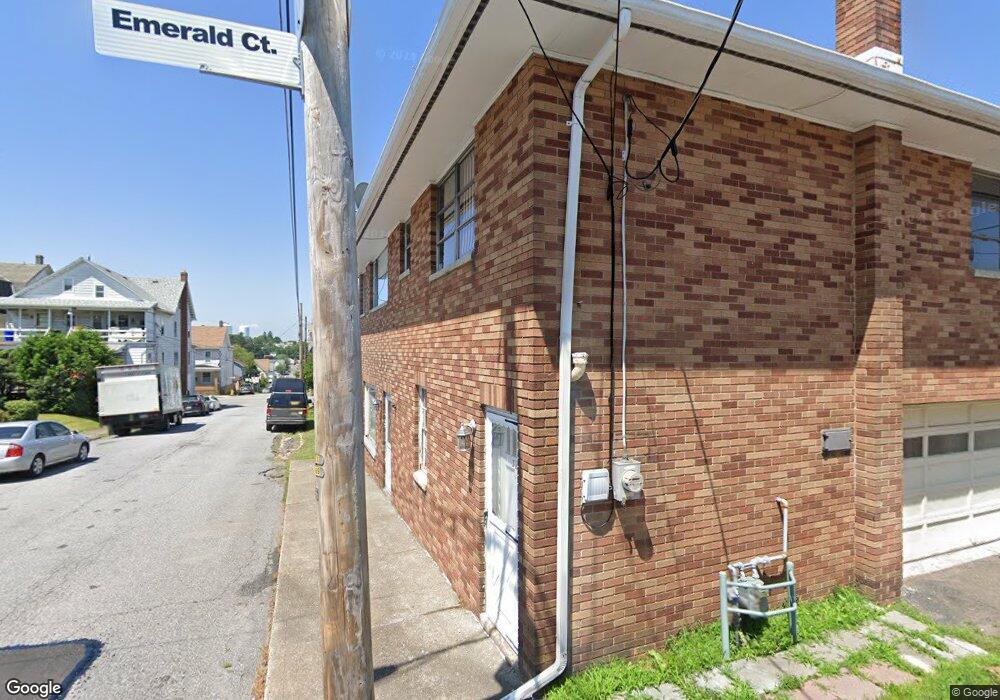
This home is located at 323 W 9th St, Hazleton, PA 18201 and is currently estimated at $207,640, approximately $84 per square foot. 323 W 9th St is a home located in Luzerne County with nearby schools including Hazleton Area High School, Immanuel Christian School, and Holy Family Academy.
Ownership History
Date
Name
Owned For
Owner Type
Purchase Details
Closed on
Oct 24, 2016
Sold by
Jovanovic Dragan and Jovanovic Radica
Bought by
Olaski Robert M and Olaski Marlene A
Current Estimated Value
Purchase Details
Closed on
Jan 28, 2006
Sold by
Martini Joseph Robert and The Estate Of Tessie Martini
Bought by
Jovanovic Dragan and Jovanovic Radica
Home Financials for this Owner
Home Financials are based on the most recent Mortgage that was taken out on this home.
Original Mortgage
$80,100
Interest Rate
6.27%
Mortgage Type
New Conventional
Create a Home Valuation Report for This Property
The Home Valuation Report is an in-depth analysis detailing your home's value as well as a comparison with similar homes in the area
Home Values in the Area
Average Home Value in this Area
Purchase History
| Date | Buyer | Sale Price | Title Company |
|---|---|---|---|
| Olaski Robert M | $50,000 | None Available | |
| Jovanovic Dragan | $89,000 | Toma Abstract Inc |
Source: Public Records
Mortgage History
| Date | Status | Borrower | Loan Amount |
|---|---|---|---|
| Previous Owner | Jovanovic Dragan | $80,100 |
Source: Public Records
Tax History
| Year | Tax Paid | Tax Assessment Tax Assessment Total Assessment is a certain percentage of the fair market value that is determined by local assessors to be the total taxable value of land and additions on the property. | Land | Improvement |
|---|---|---|---|---|
| 2025 | $2,921 | $101,700 | $20,900 | $80,800 |
| 2024 | $2,737 | $101,700 | $20,900 | $80,800 |
| 2023 | $2,559 | $101,700 | $20,900 | $80,800 |
| 2022 | $2,540 | $101,700 | $20,900 | $80,800 |
| 2021 | $2,481 | $101,700 | $20,900 | $80,800 |
| 2020 | $2,217 | $101,700 | $20,900 | $80,800 |
| 2019 | $2,287 | $101,700 | $20,900 | $80,800 |
| 2018 | $2,210 | $101,700 | $20,900 | $80,800 |
| 2017 | $2,037 | $101,700 | $20,900 | $80,800 |
| 2016 | $1,448 | $101,700 | $20,900 | $80,800 |
| 2015 | $1,450 | $101,700 | $20,900 | $80,800 |
| 2014 | $1,450 | $101,700 | $20,900 | $80,800 |
Source: Public Records
Map
Nearby Homes
- 403 W 7th St
- 714 Alter St
- 1087 N Rear Locust St
- 864 Alter St
- 19 W 14th St
- 14 W 4th St
- 127 W Diamond Ave
- 897 N Vine St
- 187 N Church St
- 555 Grant St
- ER.126 W Aspen St
- 950 N Locust St
- 756 Seybert St
- 0 Church Unit PALU2002778
- 360 W Spruce St
- 608 Mckinley St
- 56 N Laurel St
- 590 Mckinley St
- 52 N Laurel St
- 911 Seybert St
Your Personal Tour Guide
Ask me questions while you tour the home.