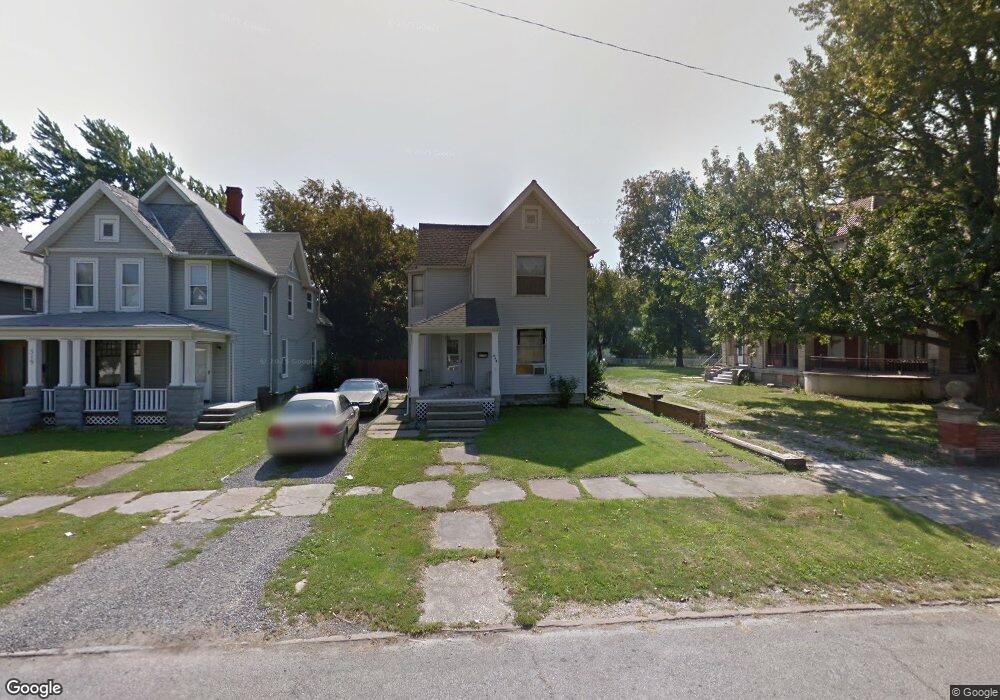
323 W 9th St Lorain, OH 44052
Estimated Value: $112,000 - $162,000
4
Beds
2
Baths
1,994
Sq Ft
$66/Sq Ft
Est. Value
About This Home
This home is located at 323 W 9th St, Lorain, OH 44052 and is currently estimated at $131,062, approximately $65 per square foot. 323 W 9th St is a home located in Lorain County with nearby schools including Admiral King Elementary School, Longfellow Middle School, and Lorain High School.
Ownership History
Date
Name
Owned For
Owner Type
Purchase Details
Closed on
Aug 25, 2001
Sold by
Kelley Patricia S and Pittman Stephanie K
Bought by
Rodriquez Ismael
Current Estimated Value
Home Financials for this Owner
Home Financials are based on the most recent Mortgage that was taken out on this home.
Original Mortgage
$61,700
Outstanding Balance
$24,270
Interest Rate
7.11%
Estimated Equity
$106,792
Purchase Details
Closed on
Jun 12, 2000
Sold by
Peak Mary A and Peak Joey N
Bought by
Kelley Patricia S and Pittman Stephanie K
Home Financials for this Owner
Home Financials are based on the most recent Mortgage that was taken out on this home.
Original Mortgage
$41,600
Interest Rate
8.31%
Purchase Details
Closed on
Aug 27, 1998
Sold by
Peak Mary A
Bought by
Peak Joey N and Peak Mary A
Home Financials for this Owner
Home Financials are based on the most recent Mortgage that was taken out on this home.
Original Mortgage
$35,750
Interest Rate
7.03%
Create a Home Valuation Report for This Property
The Home Valuation Report is an in-depth analysis detailing your home's value as well as a comparison with similar homes in the area
Home Values in the Area
Average Home Value in this Area
Purchase History
| Date | Buyer | Sale Price | Title Company |
|---|---|---|---|
| Rodriquez Ismael | $65,000 | Quality Title Agency Inc | |
| Kelley Patricia S | $52,000 | Quality Title Agency Inc | |
| Peak Joey N | -- | First Service Title Agency I |
Source: Public Records
Mortgage History
| Date | Status | Borrower | Loan Amount |
|---|---|---|---|
| Open | Rodriquez Ismael | $61,700 | |
| Previous Owner | Kelley Patricia S | $41,600 | |
| Previous Owner | Peak Joey N | $35,750 | |
| Closed | Peak Joey N | $2,500 |
Source: Public Records
Tax History
| Year | Tax Paid | Tax Assessment Tax Assessment Total Assessment is a certain percentage of the fair market value that is determined by local assessors to be the total taxable value of land and additions on the property. | Land | Improvement |
|---|---|---|---|---|
| 2024 | $1,472 | $35,714 | $5,142 | $30,573 |
| 2023 | $1,077 | $20,916 | $3,486 | $17,430 |
| 2022 | $1,068 | $20,916 | $3,486 | $17,430 |
| 2021 | $1,068 | $20,916 | $3,486 | $17,430 |
| 2020 | $1,087 | $18,490 | $3,080 | $15,410 |
| 2019 | $1,080 | $18,490 | $3,080 | $15,410 |
| 2018 | $931 | $18,490 | $3,080 | $15,410 |
| 2017 | $1,147 | $18,500 | $3,470 | $15,030 |
| 2016 | $1,138 | $18,500 | $3,470 | $15,030 |
| 2015 | $1,073 | $18,500 | $3,470 | $15,030 |
| 2014 | $991 | $17,130 | $3,210 | $13,920 |
| 2013 | $984 | $17,130 | $3,210 | $13,920 |
Source: Public Records
Map
Nearby Homes
- 322 W 9th St
- 1014 W 9th St
- 444 W 13th St
- 545 W 14th St
- 450 Washington Ave
- 1035 W 12th St
- 910 W 14th St
- 901 W 14th St
- 1115 W 11th St
- 330 W 17th St
- 831 W 17th St
- 1702 Lexington Ave
- 1140 W 5th St
- 289 W Marina Pkwy
- 517 Oberlin Ave
- 223 W 16th St
- 1725 Washington Ave
- 323 California Ave
- 1218 W 9th St
- 445 Harbor Ln
Your Personal Tour Guide
Ask me questions while you tour the home.