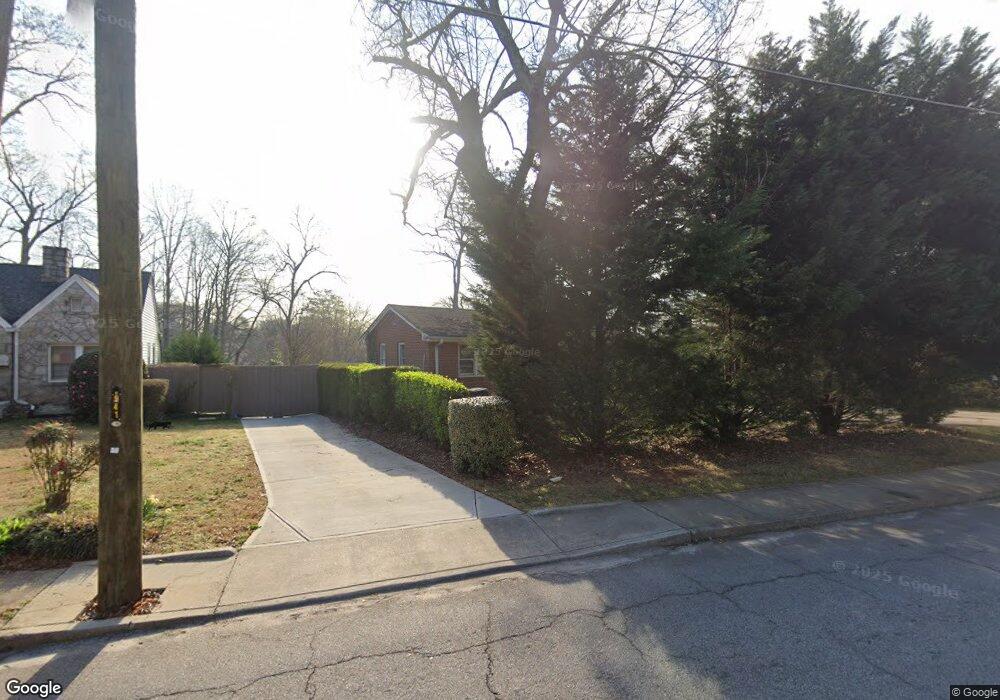
3230 N Fulton Ave Atlanta, GA 30354
Estimated Value: $215,434 - $273,000
2
Beds
1
Bath
1,098
Sq Ft
$227/Sq Ft
Est. Value
About This Home
This home is located at 3230 N Fulton Ave, Atlanta, GA 30354 and is currently estimated at $249,109, approximately $226 per square foot. 3230 N Fulton Ave is a home located in Fulton County with nearby schools including Hapeville Elementary School, Paul D. West Middle School, and Tri-Cities High School.
Ownership History
Date
Name
Owned For
Owner Type
Purchase Details
Closed on
Mar 11, 2022
Sold by
Khan Farhat Sultana
Bought by
Rk Sons & Associates
Current Estimated Value
Purchase Details
Closed on
Mar 1, 2022
Sold by
Khan Rehan Abdul
Bought by
Khan Farhat Sultana
Purchase Details
Closed on
Nov 14, 2007
Sold by
Aurora Loan Services Llc
Bought by
Khan Rehan
Purchase Details
Closed on
Aug 7, 2007
Sold by
Hodges Clifton W
Bought by
Aurora Loan Services Llc
Purchase Details
Closed on
Jun 20, 2001
Sold by
Vo Trai N and Vo Elizabeth
Bought by
Gray Dana
Home Financials for this Owner
Home Financials are based on the most recent Mortgage that was taken out on this home.
Original Mortgage
$98,455
Interest Rate
6.85%
Mortgage Type
FHA
Purchase Details
Closed on
Sep 28, 1994
Sold by
Callahan Katherine C
Bought by
Vo Trai N Elizabeth
Home Financials for this Owner
Home Financials are based on the most recent Mortgage that was taken out on this home.
Original Mortgage
$57,950
Interest Rate
8.53%
Create a Home Valuation Report for This Property
The Home Valuation Report is an in-depth analysis detailing your home's value as well as a comparison with similar homes in the area
Home Values in the Area
Average Home Value in this Area
Purchase History
| Date | Buyer | Sale Price | Title Company |
|---|---|---|---|
| Rk Sons & Associates | -- | -- | |
| Khan Farhat Sultana | -- | -- | |
| Khan Rehan | $77,000 | -- | |
| Aurora Loan Services Llc | $85,000 | -- | |
| Gray Dana | $100,000 | -- | |
| Vo Trai N Elizabeth | $61,000 | -- |
Source: Public Records
Mortgage History
| Date | Status | Borrower | Loan Amount |
|---|---|---|---|
| Previous Owner | Gray Dana | $98,455 | |
| Previous Owner | Vo Trai N Elizabeth | $57,950 |
Source: Public Records
Tax History Compared to Growth
Tax History
| Year | Tax Paid | Tax Assessment Tax Assessment Total Assessment is a certain percentage of the fair market value that is determined by local assessors to be the total taxable value of land and additions on the property. | Land | Improvement |
|---|---|---|---|---|
| 2025 | $1,661 | $91,160 | $24,200 | $66,960 |
| 2023 | $2,444 | $86,600 | $21,840 | $64,760 |
| 2022 | $2,278 | $86,600 | $21,840 | $64,760 |
| 2021 | $3,280 | $76,520 | $20,720 | $55,800 |
| 2020 | $1,401 | $32,000 | $7,400 | $24,600 |
| 2019 | $516 | $32,000 | $7,400 | $24,600 |
| 2018 | $606 | $35,760 | $7,400 | $28,360 |
| 2017 | $627 | $21,480 | $3,600 | $17,880 |
| 2016 | $627 | $21,480 | $3,600 | $17,880 |
| 2015 | $986 | $21,480 | $3,600 | $17,880 |
| 2014 | $658 | $21,480 | $3,600 | $17,880 |
Source: Public Records
Map
Nearby Homes
- 3249 N Fulton Ave
- 3261 N Fulton Ave
- 523 North Ave
- 3335 Wheeler St
- 535 Walnut St
- 3260 Russell St
- 3406 Randell Brown Ave
- 3220 Dogwood Dr
- 3216 Dogwood Dr
- 947 Willingham Dr Unit 2
- 927 Willingham Dr Unit 12
- 3189 Jackson St
- 3189 Jackson St Unit B
- 3189 Jackson St Unit A
- 514 Oak Dr
- 510 Oak Dr
- 422 Dorsey Rd
- 3098 Jackson St
- 3236 N Fulton Ave
- 3224 N Fulton Ave
- 3240 N Fulton Ave
- 3220 N Fulton Ave
- 3217 N Fulton Ave
- 3233 N Fulton Ave
- 3247 N Fulton Ave
- 00 Inquire About Address Unit 2
- 3208 N Fulton Ave
- 3219 N Fulton Ave
- 494 North Ave
- 522 North Ave
- 518 North Ave
- 490 North Ave
- 526 North Ave
- 498 North Ave
- 484 North Ave
- 532 North Ave
- 3259 N Fulton Ave
- 3259 N Fulton Ave Unit 26