3231 E High St Springfield, OH 45505
Estimated Value: $169,104 - $222,000
3
Beds
1
Bath
1,176
Sq Ft
$163/Sq Ft
Est. Value
About This Home
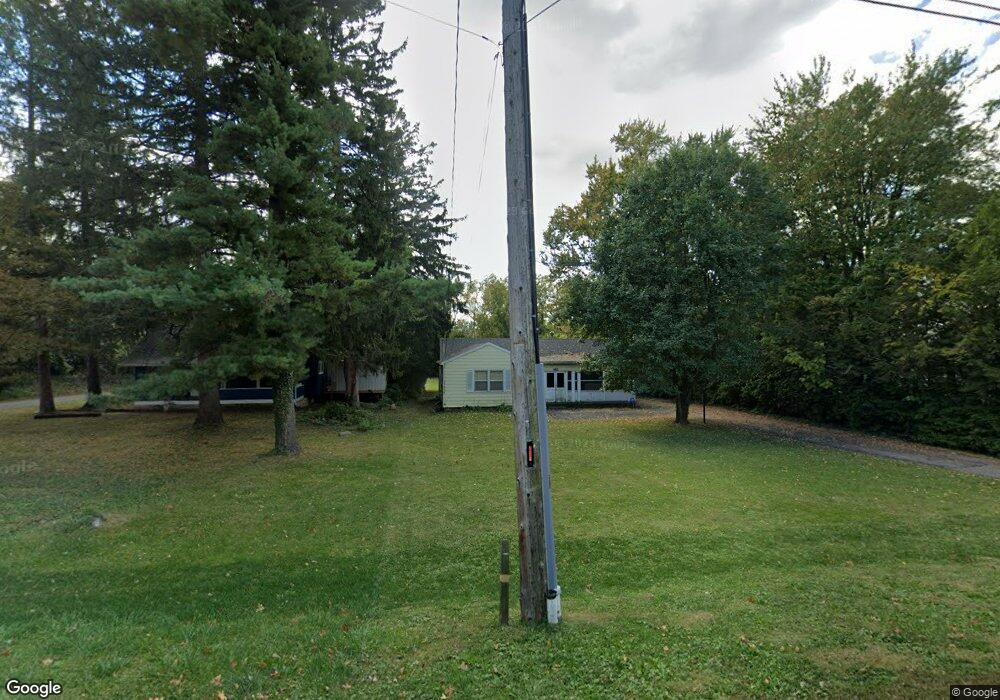
This home is located at 3231 E High St, Springfield, OH 45505 and is currently estimated at $191,776, approximately $163 per square foot. 3231 E High St is a home located in Clark County with nearby schools including Possum Elementary School, Shawnee Middle School/High School, and Catholic Central Elementary School - Lagonda Campus.
Ownership History
Date
Name
Owned For
Owner Type
Purchase Details
Closed on
May 28, 2008
Sold by
Hsbc Mortgage Services Inc
Bought by
Wilder Michael K
Current Estimated Value
Home Financials for this Owner
Home Financials are based on the most recent Mortgage that was taken out on this home.
Original Mortgage
$64,192
Outstanding Balance
$40,651
Interest Rate
6.05%
Mortgage Type
FHA
Estimated Equity
$151,125
Purchase Details
Closed on
Sep 28, 2007
Sold by
Keating Terry L and Keating Tracy L
Bought by
Hsbc Mortgage Services Inc
Purchase Details
Closed on
Aug 31, 2005
Sold by
Brooks Barry T and Estate Of Laura B Brooks
Bought by
Keating Terry L and Keating Tracy L
Home Financials for this Owner
Home Financials are based on the most recent Mortgage that was taken out on this home.
Original Mortgage
$110,000
Interest Rate
9.4%
Mortgage Type
Fannie Mae Freddie Mac
Create a Home Valuation Report for This Property
The Home Valuation Report is an in-depth analysis detailing your home's value as well as a comparison with similar homes in the area
Home Values in the Area
Average Home Value in this Area
Purchase History
| Date | Buyer | Sale Price | Title Company |
|---|---|---|---|
| Wilder Michael K | $64,700 | Ohio Real Estate Title | |
| Hsbc Mortgage Services Inc | $61,000 | None Available | |
| Keating Terry L | $110,000 | Vantage Land Title Inc |
Source: Public Records
Mortgage History
| Date | Status | Borrower | Loan Amount |
|---|---|---|---|
| Open | Wilder Michael K | $64,192 | |
| Previous Owner | Keating Terry L | $110,000 |
Source: Public Records
Tax History
| Year | Tax Paid | Tax Assessment Tax Assessment Total Assessment is a certain percentage of the fair market value that is determined by local assessors to be the total taxable value of land and additions on the property. | Land | Improvement |
|---|---|---|---|---|
| 2025 | $1,910 | $48,460 | $12,500 | $35,960 |
| 2024 | $1,862 | $37,300 | $9,040 | $28,260 |
| 2023 | $1,862 | $37,300 | $9,040 | $28,260 |
| 2022 | $1,847 | $37,300 | $9,040 | $28,260 |
| 2021 | $1,599 | $28,920 | $7,010 | $21,910 |
| 2020 | $1,612 | $28,920 | $7,010 | $21,910 |
| 2019 | $1,638 | $28,920 | $7,010 | $21,910 |
| 2018 | $1,551 | $27,000 | $6,370 | $20,630 |
| 2017 | $1,589 | $27,000 | $6,374 | $20,626 |
| 2016 | $1,437 | $27,000 | $6,374 | $20,626 |
| 2015 | $1,445 | $26,244 | $6,374 | $19,870 |
| 2014 | $1,449 | $26,244 | $6,374 | $19,870 |
| 2013 | $1,263 | $26,244 | $6,374 | $19,870 |
Source: Public Records
Map
Nearby Homes
- 507 Elbron Rd
- 631 Kramer Rd
- 3012 E High St
- 451 Lawnview Ave
- 218 Golden Gate Ave
- 224 Mackinac Dr
- 138 Lawnview Ave
- 224 Roebling St
- 2804 Lowman St
- 2745 Share St
- 255 S Bird Rd
- 2809 Morton Dr
- 1011 Mount Joy St
- 180 Chesapeake Cir
- 2730 E Main St
- 2702 Maplewood Ave
- 115 S Burnett Rd
- 360 Buxton Ave
- 375 N Fostoria Ave
- 374 Raffensperger Ave
Your Personal Tour Guide
Ask me questions while you tour the home.