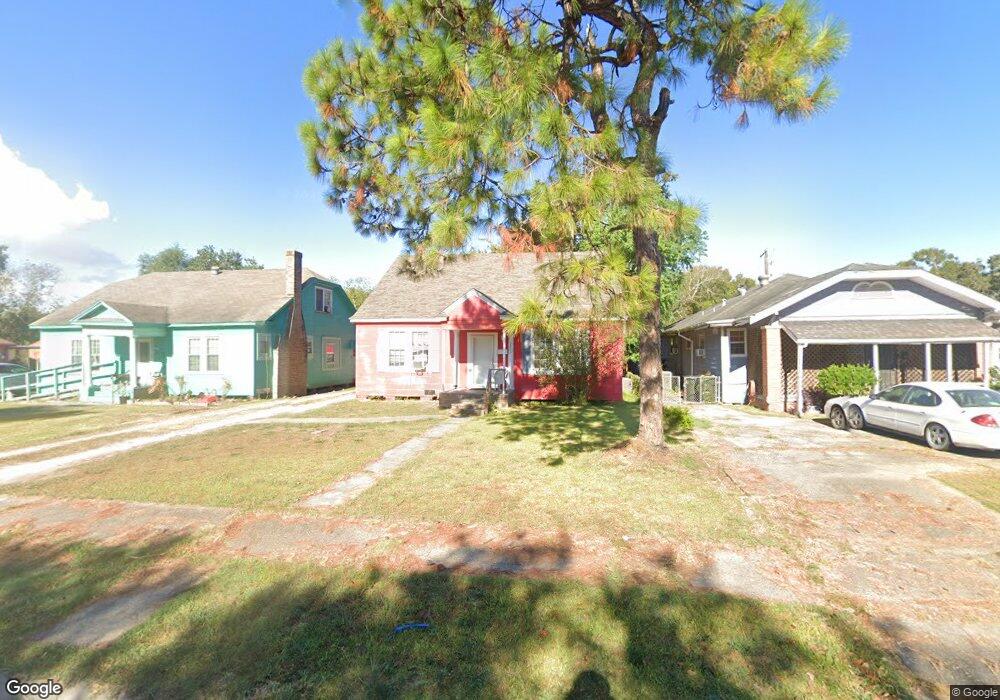
3231 Thomas Blvd Port Arthur, TX 77642
Estimated Value: $52,000 - $70,000
--
Bed
--
Bath
1,092
Sq Ft
$57/Sq Ft
Est. Value
About This Home
This home is located at 3231 Thomas Blvd, Port Arthur, TX 77642 and is currently estimated at $62,680, approximately $57 per square foot. 3231 Thomas Blvd is a home located in Jefferson County with nearby schools including DeQueen Elementary School, Abraham Lincoln Middle School, and Memorial High School.
Ownership History
Date
Name
Owned For
Owner Type
Purchase Details
Closed on
Apr 24, 2003
Sold by
Espree Twana R
Bought by
Barkers Demarcus W
Current Estimated Value
Home Financials for this Owner
Home Financials are based on the most recent Mortgage that was taken out on this home.
Original Mortgage
$33,250
Outstanding Balance
$16,726
Interest Rate
8.12%
Mortgage Type
Purchase Money Mortgage
Estimated Equity
$45,954
Purchase Details
Closed on
Mar 31, 2003
Sold by
Richard Lou H
Bought by
Espree Twana R
Home Financials for this Owner
Home Financials are based on the most recent Mortgage that was taken out on this home.
Original Mortgage
$33,250
Outstanding Balance
$16,726
Interest Rate
8.12%
Mortgage Type
Purchase Money Mortgage
Estimated Equity
$45,954
Purchase Details
Closed on
Jan 31, 2001
Sold by
Johnson Lee and Johnson Anne
Bought by
Richard Lou
Create a Home Valuation Report for This Property
The Home Valuation Report is an in-depth analysis detailing your home's value as well as a comparison with similar homes in the area
Home Values in the Area
Average Home Value in this Area
Purchase History
| Date | Buyer | Sale Price | Title Company |
|---|---|---|---|
| Barkers Demarcus W | -- | -- | |
| Espree Twana R | -- | -- | |
| Richard Lou | -- | -- |
Source: Public Records
Mortgage History
| Date | Status | Borrower | Loan Amount |
|---|---|---|---|
| Open | Barkers Demarcus W | $33,250 |
Source: Public Records
Tax History Compared to Growth
Tax History
| Year | Tax Paid | Tax Assessment Tax Assessment Total Assessment is a certain percentage of the fair market value that is determined by local assessors to be the total taxable value of land and additions on the property. | Land | Improvement |
|---|---|---|---|---|
| 2025 | $1,604 | $56,130 | $7,250 | $48,880 |
| 2024 | $1,604 | $56,010 | $2,475 | $53,535 |
| 2023 | $1,604 | $52,197 | $990 | $51,207 |
| 2022 | $983 | $30,946 | $0 | $0 |
| 2021 | $932 | $42,887 | $990 | $41,897 |
| 2020 | $363 | $26,681 | $990 | $25,691 |
| 2019 | $741 | $23,250 | $990 | $22,260 |
| 2018 | $282 | $21,540 | $990 | $20,550 |
| 2017 | $268 | $21,540 | $990 | $20,550 |
| 2016 | $631 | $21,540 | $990 | $20,550 |
| 2015 | $358 | $21,540 | $990 | $20,550 |
| 2014 | $358 | $21,540 | $990 | $20,550 |
Source: Public Records
Map
Nearby Homes