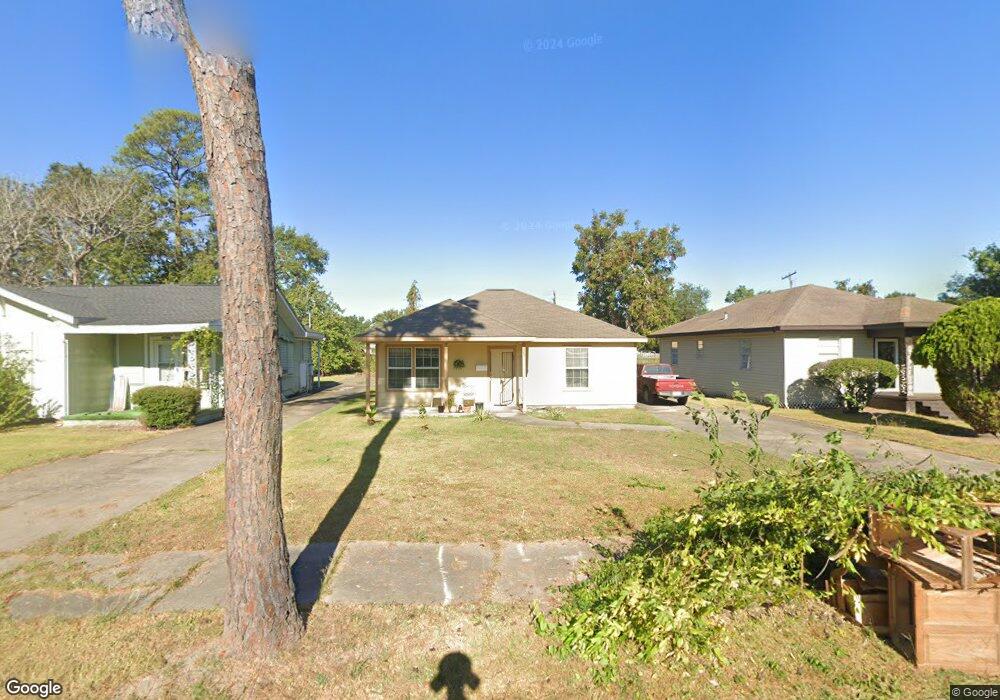
3233 11th St Port Arthur, TX 77642
Estimated Value: $93,563 - $144,000
--
Bed
--
Bath
868
Sq Ft
$125/Sq Ft
Est. Value
About This Home
This home is located at 3233 11th St, Port Arthur, TX 77642 and is currently estimated at $108,391, approximately $124 per square foot. 3233 11th St is a home located in Jefferson County with nearby schools including DeQueen Elementary School, Abraham Lincoln Middle School, and Memorial High School.
Ownership History
Date
Name
Owned For
Owner Type
Purchase Details
Closed on
Sep 24, 2024
Sold by
Babineaux Dwight Martin and Babineaux-Bergeron Jean
Bought by
Figueroa Esperanza
Current Estimated Value
Home Financials for this Owner
Home Financials are based on the most recent Mortgage that was taken out on this home.
Original Mortgage
$35,000
Outstanding Balance
$28,946
Interest Rate
6.49%
Mortgage Type
Seller Take Back
Estimated Equity
$79,445
Create a Home Valuation Report for This Property
The Home Valuation Report is an in-depth analysis detailing your home's value as well as a comparison with similar homes in the area
Home Values in the Area
Average Home Value in this Area
Purchase History
| Date | Buyer | Sale Price | Title Company |
|---|---|---|---|
| Figueroa Esperanza | -- | Corporation Service |
Source: Public Records
Mortgage History
| Date | Status | Borrower | Loan Amount |
|---|---|---|---|
| Open | Figueroa Esperanza | $35,000 |
Source: Public Records
Tax History Compared to Growth
Tax History
| Year | Tax Paid | Tax Assessment Tax Assessment Total Assessment is a certain percentage of the fair market value that is determined by local assessors to be the total taxable value of land and additions on the property. | Land | Improvement |
|---|---|---|---|---|
| 2025 | $2,929 | $103,248 | $7,000 | $96,248 |
| 2024 | $2,929 | $102,263 | $2,450 | $99,813 |
| 2023 | $2,929 | $100,793 | $980 | $99,813 |
| 2022 | $2,546 | $80,180 | $980 | $79,200 |
| 2021 | $2,274 | $68,610 | $980 | $67,630 |
| 2020 | $1,462 | $44,119 | $980 | $43,139 |
| 2019 | $1,406 | $44,120 | $980 | $43,140 |
| 2018 | $1,234 | $38,720 | $980 | $37,740 |
| 2017 | $704 | $38,720 | $980 | $37,740 |
| 2016 | $1,134 | $38,720 | $980 | $37,740 |
| 2015 | $817 | $38,380 | $980 | $37,400 |
| 2014 | $817 | $38,380 | $980 | $37,400 |
Source: Public Records
Map
Nearby Homes