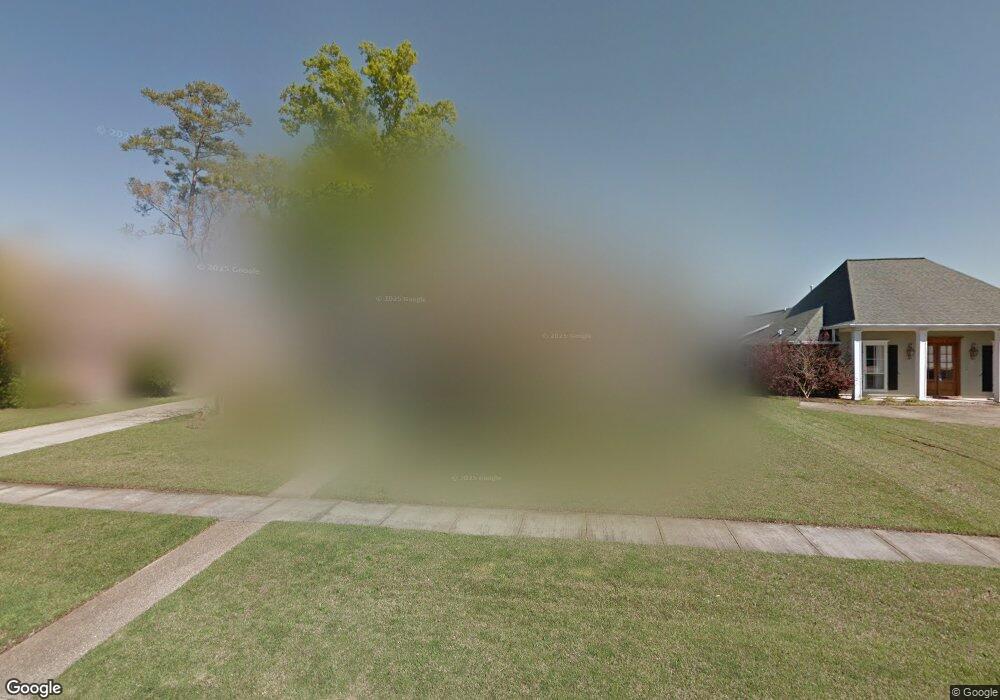
3233 White Lane Dr Baton Rouge, LA 70816
Shenandoah NeighborhoodEstimated Value: $361,000 - $385,000
4
Beds
3
Baths
2,252
Sq Ft
$166/Sq Ft
Est. Value
About This Home
This home is located at 3233 White Lane Dr, Baton Rouge, LA 70816 and is currently estimated at $373,441, approximately $165 per square foot. 3233 White Lane Dr is a home located in East Baton Rouge Parish with nearby schools including Wedgewood Elementary School, Southeast Middle School, and Tara High School.
Ownership History
Date
Name
Owned For
Owner Type
Purchase Details
Closed on
Jan 16, 2008
Sold by
Johnson Vernet E
Bought by
Lowe Ronald S
Current Estimated Value
Home Financials for this Owner
Home Financials are based on the most recent Mortgage that was taken out on this home.
Original Mortgage
$205,600
Outstanding Balance
$128,283
Interest Rate
5.94%
Mortgage Type
New Conventional
Estimated Equity
$245,158
Purchase Details
Closed on
Jun 30, 2000
Sold by
Bankston Walter R & Associates Inc
Bought by
Herman Paul E and Herman Carole B
Purchase Details
Closed on
Apr 23, 1999
Sold by
Jcm Enterprises Inc
Bought by
Johnson Vernet Elton and Johnson Alisa Dyer
Home Financials for this Owner
Home Financials are based on the most recent Mortgage that was taken out on this home.
Original Mortgage
$174,300
Interest Rate
7.16%
Purchase Details
Closed on
Dec 3, 1998
Sold by
Walter R Bankstone & Associates Inc
Bought by
Jcm Enterprises Inc
Create a Home Valuation Report for This Property
The Home Valuation Report is an in-depth analysis detailing your home's value as well as a comparison with similar homes in the area
Home Values in the Area
Average Home Value in this Area
Purchase History
| Date | Buyer | Sale Price | Title Company |
|---|---|---|---|
| Lowe Ronald S | $257,000 | -- | |
| Herman Paul E | $281 | -- | |
| Johnson Vernet Elton | $183,500 | -- | |
| Jcm Enterprises Inc | $39,425 | -- |
Source: Public Records
Mortgage History
| Date | Status | Borrower | Loan Amount |
|---|---|---|---|
| Open | Lowe Ronald S | $205,600 | |
| Previous Owner | Johnson Vernet Elton | $174,300 |
Source: Public Records
Tax History Compared to Growth
Tax History
| Year | Tax Paid | Tax Assessment Tax Assessment Total Assessment is a certain percentage of the fair market value that is determined by local assessors to be the total taxable value of land and additions on the property. | Land | Improvement |
|---|---|---|---|---|
| 2024 | $3,241 | $33,465 | $4,500 | $28,965 |
| 2023 | $3,241 | $29,000 | $4,500 | $24,500 |
| 2022 | $3,662 | $29,000 | $4,500 | $24,500 |
| 2021 | $3,599 | $29,000 | $4,500 | $24,500 |
| 2020 | $3,641 | $29,000 | $4,500 | $24,500 |
| 2019 | $3,181 | $25,700 | $4,500 | $21,200 |
| 2018 | $3,142 | $25,700 | $4,500 | $21,200 |
| 2017 | $3,142 | $25,700 | $4,500 | $21,200 |
| 2016 | $1,305 | $18,280 | $4,500 | $13,780 |
| 2015 | $2,180 | $25,700 | $4,500 | $21,200 |
| 2014 | $2,172 | $25,700 | $4,500 | $21,200 |
| 2013 | -- | $25,700 | $4,500 | $21,200 |
Source: Public Records
Map
Nearby Homes
- 18403 Shadow Creek Ave
- 18107 Ferry Lane Ave
- 18526 Shadow Creek Ave
- 17561 Martin Lake Dr
- 18946 Lake Harbour Ave
- 3912 Indian Run Dr
- 3306 Grassy Lake Dr
- 3112 Grassy Lake Dr
- 17633 E Fort Pickens Ave
- 17237 Monitor Ave
- 3246 Pine Grove Dr
- 17440 Beachwood Ave
- 4036 Copperridge Dr
- 3439 Timber Grove Dr
- 5246 Stones River Ave
- 5487 Hagerstown Dr
- 3801 Villa Michel Dr
- 16849 Monitor Ave
- 3146 Silver Sand Dr
- 19537 S Harrells Ferry Rd
- 3223 White Lane Dr
- 0 White Lane Dr
- 3222 Harrells Lane Dr
- 3213 White Lane Dr
- 3253 White Lane Dr
- 3212 Harrells Lane Dr
- 3304 Harrells Lane Dr
- 3202 Harrells Lane Dr
- 3234 White Lane Dr
- 3244 White Lane Dr
- 3224 White Lane Dr
- 3158 Harrells Lane Dr
- 3305 White Lane Dr
- 3314 Harrells Lane Dr
- 3214 White Lane Dr
- 3203 White Lane Dr
- 3204 White Lane Dr
- 3306 White Lane Dr
- 0000 Harrells Lane Dr
- 0 Harrells Lane Dr