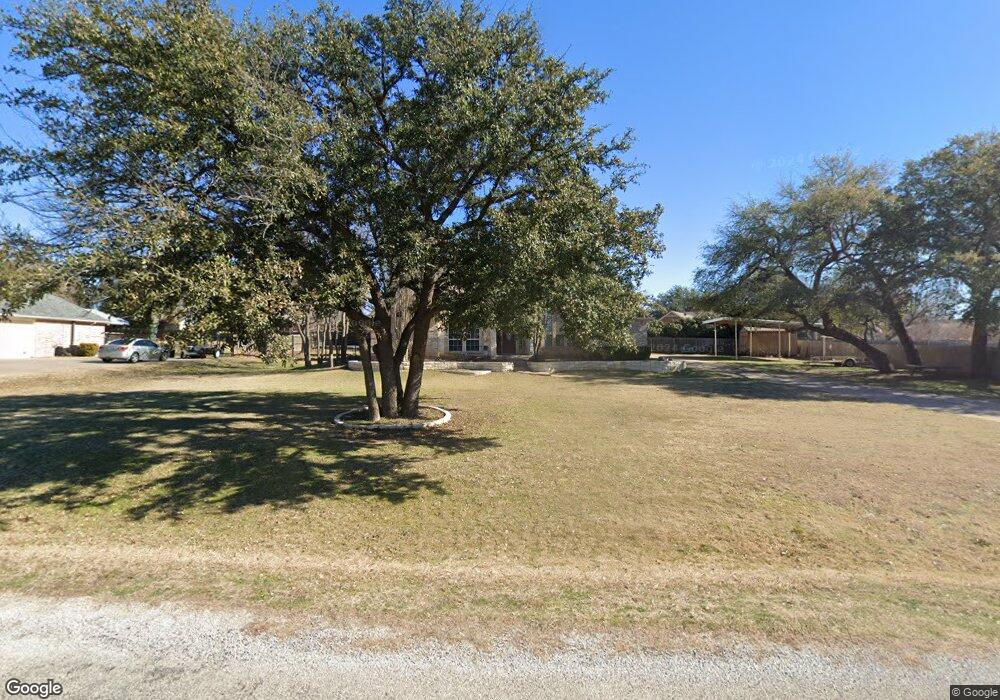
3234 Golden Oaks Cir Granbury, TX 76049
Estimated Value: $538,910 - $612,000
4
Beds
4
Baths
3,085
Sq Ft
$186/Sq Ft
Est. Value
About This Home
This home is located at 3234 Golden Oaks Cir, Granbury, TX 76049 and is currently estimated at $573,228, approximately $185 per square foot. 3234 Golden Oaks Cir is a home located in Hood County with nearby schools including Acton Elementary School, Acton Middle School, and Granbury High School.
Ownership History
Date
Name
Owned For
Owner Type
Purchase Details
Closed on
May 12, 2017
Sold by
Zimmerman Alice Christine and Bridges Alice Chirstine
Bought by
Chastain Gary M and Chastain Georgia
Current Estimated Value
Purchase Details
Closed on
Feb 26, 2016
Sold by
Landrum Thearon W and Landrum Maura A
Bought by
Bridges Alice Christine
Home Financials for this Owner
Home Financials are based on the most recent Mortgage that was taken out on this home.
Original Mortgage
$212,000
Interest Rate
3.92%
Mortgage Type
New Conventional
Purchase Details
Closed on
Apr 30, 2004
Sold by
Rainbolt Lance
Bought by
Chastain Gary M and Chastain Georgia
Purchase Details
Closed on
Jun 6, 2001
Sold by
Marley Lane & Development Co
Bought by
Chastain Gary M and Chastain Georgia
Purchase Details
Closed on
May 10, 2000
Sold by
Marley Investments L P
Bought by
Chastain Gary M and Chastain Georgia
Create a Home Valuation Report for This Property
The Home Valuation Report is an in-depth analysis detailing your home's value as well as a comparison with similar homes in the area
Home Values in the Area
Average Home Value in this Area
Purchase History
| Date | Buyer | Sale Price | Title Company |
|---|---|---|---|
| Chastain Gary M | -- | Central Texas Title Main | |
| Bridges Alice Christine | -- | Porter Title Company | |
| Chastain Gary M | -- | -- | |
| Chastain Gary M | -- | -- | |
| Chastain Gary M | -- | -- |
Source: Public Records
Mortgage History
| Date | Status | Borrower | Loan Amount |
|---|---|---|---|
| Previous Owner | Bridges Alice Christine | $212,000 |
Source: Public Records
Tax History Compared to Growth
Tax History
| Year | Tax Paid | Tax Assessment Tax Assessment Total Assessment is a certain percentage of the fair market value that is determined by local assessors to be the total taxable value of land and additions on the property. | Land | Improvement |
|---|---|---|---|---|
| 2025 | $6,557 | $546,830 | $45,000 | $501,830 |
| 2024 | $5,747 | $472,330 | $45,000 | $427,330 |
| 2023 | $5,811 | $477,540 | $45,000 | $432,540 |
| 2022 | $5,857 | $440,150 | $30,000 | $410,150 |
| 2021 | $5,615 | $365,760 | $30,000 | $335,760 |
| 2020 | $5,159 | $332,200 | $30,000 | $302,200 |
| 2019 | $5,167 | $317,810 | $30,000 | $287,810 |
| 2018 | $4,721 | $290,380 | $30,000 | $260,380 |
| 2017 | $4,682 | $280,000 | $30,000 | $250,000 |
| 2016 | $4,531 | $270,940 | $30,000 | $240,940 |
| 2015 | $4,338 | $273,410 | $30,000 | $243,410 |
| 2014 | $4,338 | $273,410 | $30,000 | $243,410 |
Source: Public Records
Map
Nearby Homes
- 3218 Fountain Way
- 3207 Hummingbird Ct
- 2925 Willow Ridge Cir
- 4920 Centre Ct
- 4512 Cimmaron Trail
- 2936 Willow Ridge Cir
- 3510 Fountain Way
- 2918 James Rd
- 3119 Bob White Dr
- 1141 Avery Rd
- 1144 Avery Rd
- 1136 Avery Rd
- 5003 Bueno Dr
- 3707 Bob White Dr
- 2445 Bob White Dr
- 4410 Halo Ct
- 5102 Largo Dr
- 4312 Rhea Rd
- 3609 Upper Lake Cir
- 4363 Acton Hwy
- 3236 Golden Oaks Cir
- 3210 Golden Oaks Cir
- 3226 Golden Oaks Cir
- 3218 Golden Oaks Cir
- 3235 Golden Oaks Cir
- 3233 Golden Oaks Cir
- 3208 Golden Oaks Cir
- 3237 Golden Oaks Cir
- 3206 Golden Oaks Cir
- 3238 Golden Oaks Cir
- 3231 Golden Oaks Cir
- 3204 Golden Oaks Cir
- 3219 Golden Oaks Cir
- 3217 Golden Oaks Cir
- 3221 Golden Oaks Cir
- 3211 Golden Oaks Cir
- 3209 Golden Oaks Cir
- 3215 Golden Oaks Cir
- 3240 Golden Oaks Cir
- 3207 Golden Oaks Cir