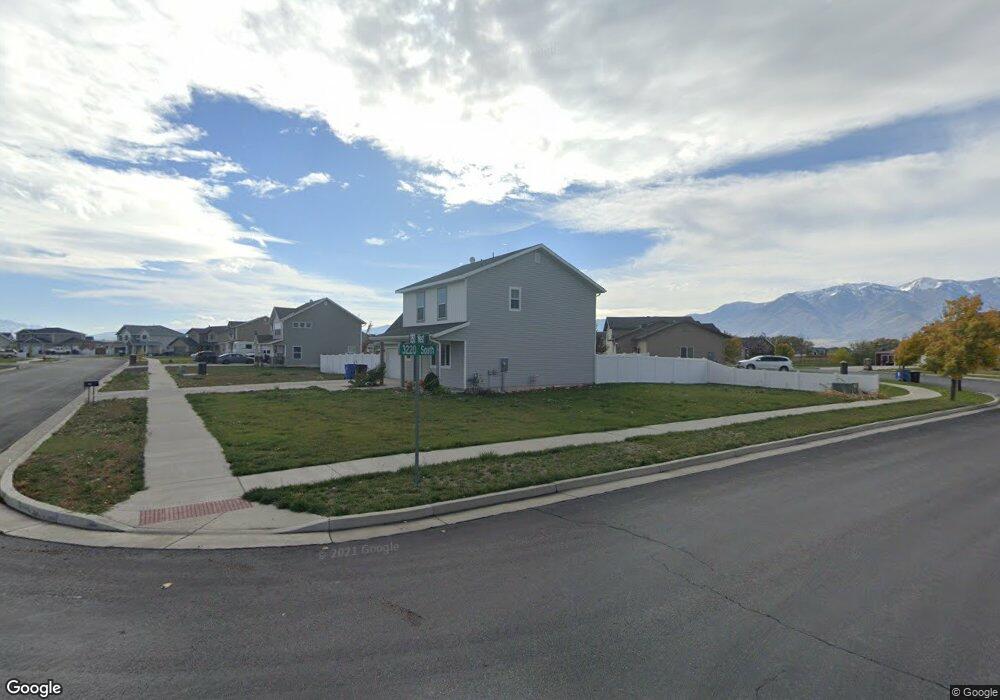
3235 S 1350 W Nibley, UT 84321
Estimated Value: $450,000 - $528,000
4
Beds
3
Baths
1,620
Sq Ft
$293/Sq Ft
Est. Value
About This Home
This home is located at 3235 S 1350 W, Nibley, UT 84321 and is currently estimated at $474,270, approximately $292 per square foot. 3235 S 1350 W is a home located in Cache County with nearby schools including Heritage School, South Cache Middle School, and Spring Creek Middle School.
Ownership History
Date
Name
Owned For
Owner Type
Purchase Details
Closed on
Oct 4, 2021
Sold by
Middleton Richard Jamahl
Bought by
Larsen Tyler and Larsen Megan
Current Estimated Value
Home Financials for this Owner
Home Financials are based on the most recent Mortgage that was taken out on this home.
Original Mortgage
$393,939
Outstanding Balance
$358,800
Interest Rate
3.01%
Estimated Equity
$115,470
Purchase Details
Closed on
Jul 30, 2020
Sold by
Paz Marlene and Paz Torres Leopoldo
Bought by
Middleton Richard Jamarl
Home Financials for this Owner
Home Financials are based on the most recent Mortgage that was taken out on this home.
Original Mortgage
$292,000
Interest Rate
3.1%
Mortgage Type
New Conventional
Purchase Details
Closed on
Feb 14, 2020
Sold by
Paz Marlene and Magania Rincon Felipe
Bought by
Paz Marlene and Paz Torres Leopoldo
Home Financials for this Owner
Home Financials are based on the most recent Mortgage that was taken out on this home.
Original Mortgage
$221,000
Interest Rate
3.6%
Mortgage Type
New Conventional
Purchase Details
Closed on
Jan 17, 2018
Sold by
Champman Harley A and Champman Annie
Bought by
Magania Paz Mariene and Magania Rincon Felipe
Purchase Details
Closed on
Nov 21, 2012
Sold by
Chapman Harley A
Bought by
Chapman Harley A and Chapman Annie
Home Financials for this Owner
Home Financials are based on the most recent Mortgage that was taken out on this home.
Original Mortgage
$142,515
Interest Rate
3.35%
Mortgage Type
New Conventional
Purchase Details
Closed on
Sep 6, 2011
Sold by
Mv Properties Llc
Bought by
Highmark Construction Inc
Home Financials for this Owner
Home Financials are based on the most recent Mortgage that was taken out on this home.
Original Mortgage
$111,700
Interest Rate
4.46%
Mortgage Type
Construction
Create a Home Valuation Report for This Property
The Home Valuation Report is an in-depth analysis detailing your home's value as well as a comparison with similar homes in the area
Home Values in the Area
Average Home Value in this Area
Purchase History
| Date | Buyer | Sale Price | Title Company |
|---|---|---|---|
| Larsen Tyler | -- | American Secure Title Logan | |
| Middleton Richard Jamarl | -- | Cache Title Logan | |
| Paz Marlene | -- | Advanced Title | |
| Magania Paz Mariene | -- | -- | |
| Chapman Harley A | -- | American Secure Title Logan | |
| Chapman Harley A | -- | American Secure Title Logan | |
| Highmark Construction Inc | -- | American Secure Title Logan |
Source: Public Records
Mortgage History
| Date | Status | Borrower | Loan Amount |
|---|---|---|---|
| Open | Larsen Tyler | $393,939 | |
| Previous Owner | Middleton Richard Jamarl | $292,000 | |
| Previous Owner | Paz Marlene | $221,000 | |
| Previous Owner | Chapman Harley A | $142,515 | |
| Previous Owner | Highmark Construction Inc | $111,700 |
Source: Public Records
Tax History Compared to Growth
Tax History
| Year | Tax Paid | Tax Assessment Tax Assessment Total Assessment is a certain percentage of the fair market value that is determined by local assessors to be the total taxable value of land and additions on the property. | Land | Improvement |
|---|---|---|---|---|
| 2025 | $18 | $243,770 | $0 | $0 |
| 2024 | $1,963 | $244,310 | $0 | $0 |
| 2023 | $2,075 | $241,780 | $0 | $0 |
| 2022 | $2,160 | $241,780 | $0 | $0 |
| 2021 | $1,592 | $276,789 | $60,000 | $216,789 |
| 2020 | $1,501 | $248,513 | $60,000 | $188,513 |
| 2019 | $1,575 | $248,512 | $60,000 | $188,512 |
| 2018 | $1,353 | $208,315 | $40,000 | $168,315 |
| 2017 | $1,351 | $110,165 | $0 | $0 |
| 2016 | $1,366 | $83,500 | $0 | $0 |
| 2015 | $1,029 | $83,500 | $0 | $0 |
| 2014 | $1,005 | $83,500 | $0 | $0 |
| 2013 | -- | $87,350 | $0 | $0 |
Source: Public Records
Map
Nearby Homes