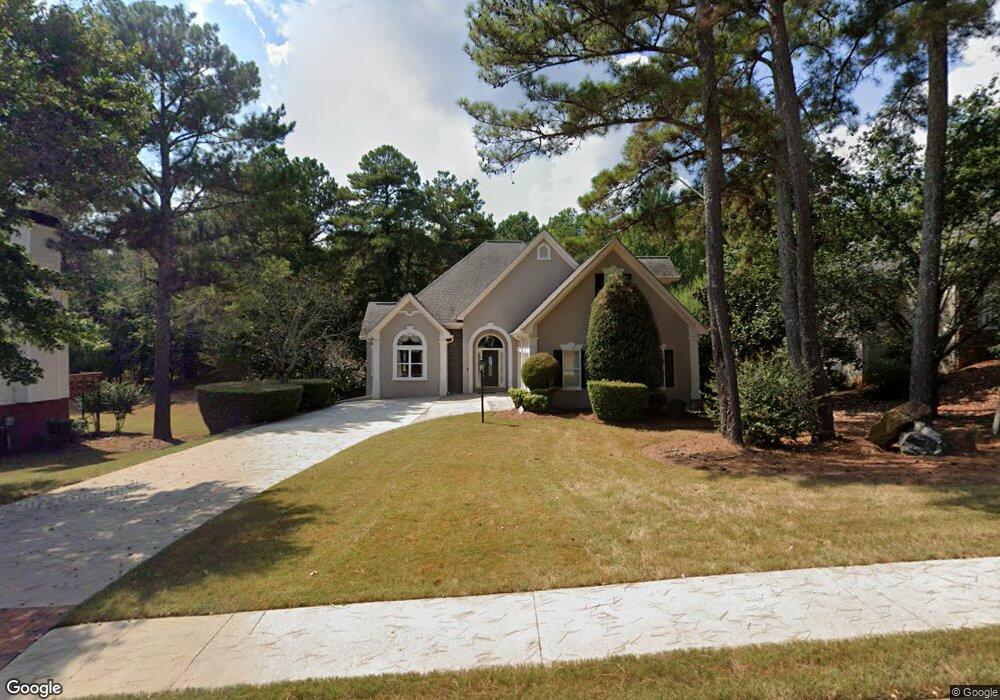
3235 Thorneridge Trail Unit 1 Douglasville, GA 30135
Lithia Springs NeighborhoodEstimated Value: $376,871 - $462,000
3
Beds
3
Baths
2,656
Sq Ft
$156/Sq Ft
Est. Value
About This Home
This home is located at 3235 Thorneridge Trail Unit 1, Douglasville, GA 30135 and is currently estimated at $414,468, approximately $156 per square foot. 3235 Thorneridge Trail Unit 1 is a home located in Douglas County with nearby schools including Factory Shoals Elementary School, Factory Shoals Middle School, and New Manchester High School.
Ownership History
Date
Name
Owned For
Owner Type
Purchase Details
Closed on
Dec 22, 2010
Sold by
Jackson Donald
Bought by
Jackson Donald
Current Estimated Value
Purchase Details
Closed on
Aug 28, 2002
Sold by
Jonhson Edward J
Bought by
Jackson Donald
Home Financials for this Owner
Home Financials are based on the most recent Mortgage that was taken out on this home.
Original Mortgage
$184,000
Interest Rate
6.27%
Mortgage Type
New Conventional
Purchase Details
Closed on
Mar 28, 1997
Sold by
Aja Inc
Bought by
Johnson Edward and Bonneau Paul
Purchase Details
Closed on
Jun 18, 1996
Sold by
Greythorne Llc
Bought by
Aja Inc
Create a Home Valuation Report for This Property
The Home Valuation Report is an in-depth analysis detailing your home's value as well as a comparison with similar homes in the area
Home Values in the Area
Average Home Value in this Area
Purchase History
| Date | Buyer | Sale Price | Title Company |
|---|---|---|---|
| Jackson Donald | -- | -- | |
| Jackson Donald | $230,000 | -- | |
| Johnson Edward | $205,900 | -- | |
| Aja Inc | $28,900 | -- |
Source: Public Records
Mortgage History
| Date | Status | Borrower | Loan Amount |
|---|---|---|---|
| Previous Owner | Jackson Donald | $184,000 | |
| Closed | Aja Inc | $0 |
Source: Public Records
Tax History Compared to Growth
Tax History
| Year | Tax Paid | Tax Assessment Tax Assessment Total Assessment is a certain percentage of the fair market value that is determined by local assessors to be the total taxable value of land and additions on the property. | Land | Improvement |
|---|---|---|---|---|
| 2024 | $1,088 | $143,480 | $26,000 | $117,480 |
| 2023 | $1,088 | $143,480 | $26,000 | $117,480 |
| 2022 | $1,130 | $143,480 | $26,000 | $117,480 |
| 2021 | $3,110 | $102,520 | $14,000 | $88,520 |
| 2020 | $3,129 | $101,120 | $15,280 | $85,840 |
| 2019 | $2,734 | $90,640 | $14,040 | $76,600 |
| 2018 | $2,895 | $97,680 | $15,640 | $82,040 |
| 2017 | $2,740 | $87,920 | $15,640 | $72,280 |
| 2016 | $2,419 | $76,560 | $14,400 | $62,160 |
| 2015 | $2,336 | $72,520 | $14,040 | $58,480 |
| 2014 | $1,817 | $55,760 | $11,680 | $44,080 |
| 2013 | -- | $52,520 | $11,160 | $41,360 |
Source: Public Records
Map
Nearby Homes
- 0 Mountain Brook Ct Unit 10435858
- 0 Mountain Brook Ct Unit 7505252
- 3188 Christopher Ct
- 3327 Surveyor Ct
- 2450 Washington Dr
- 2619 Del Ridge Dr
- 3073 Virginia Place
- 3387 Surveyor Ct
- 2656 Del Ridge Dr
- 3380 Palmer Lake
- 2756 Del Ridge Dr
- 2425 River Place Crossing
- 2928 Legion Lake Rd
- 3251 Blackley Old Rd
- 2306 Old Lower River Rd
- 3212 Wheldon Way
- 3243 Bakewell St
- 3234 Blackley Old Rd
- 3245 Thorneridge Trail
- 3225 Thorneridge Trail Unit 1
- 3255 Thorneridge Trail
- 3215 Thorneridge Trail
- 3230 Thorneridge Trail
- 3240 Thorneridge Trail
- 3220 Thorneridge Trail
- 3250 Thorneridge Trail
- 3265 Thorneridge Trail
- 3205 Thorneridge Trail Unit 1
- 3210 Thorneridge Trail
- 3260 Thorneridge Trail
- 3275 Thorneridge Trail
- 3200 Thorneridge Trail Unit 1
- 3270 Thorneridge Trail Unit 1
- 3233 Thornecreek Dr Unit 4
- 3243 Thornecreek Dr Unit 4
- 3195 Thorneridge Trail
- 3253 Thornecreek Dr Unit 4
- 3244 Georgia 92