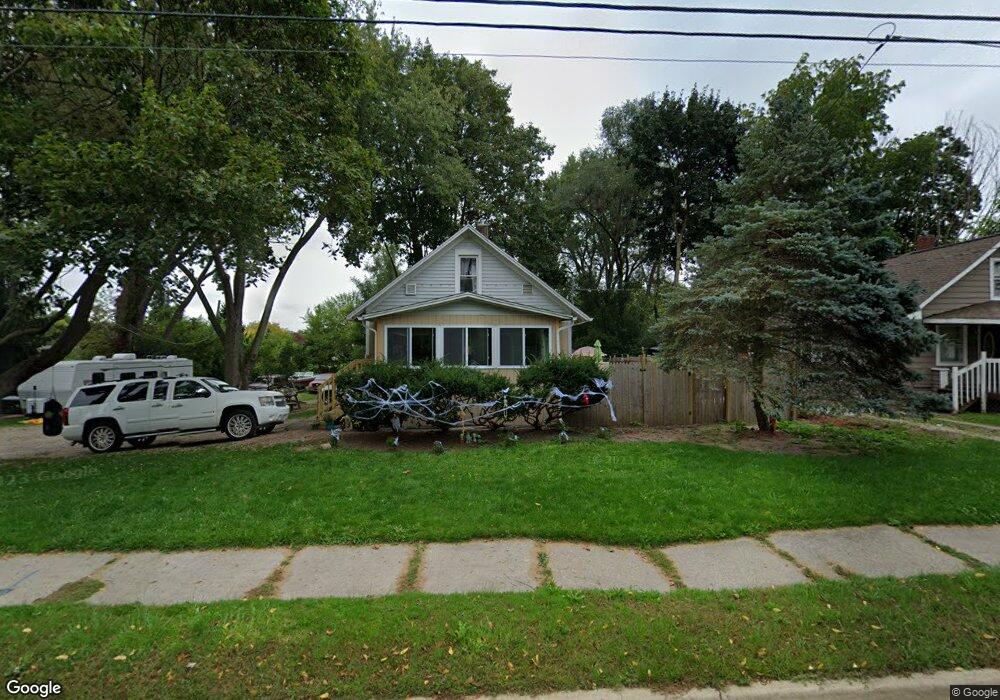
3235 W Mount Hope Ave Lansing, MI 48911
Moores River Drive NeighborhoodEstimated Value: $91,123 - $150,000
--
Bed
--
Bath
832
Sq Ft
$133/Sq Ft
Est. Value
About This Home
This home is located at 3235 W Mount Hope Ave, Lansing, MI 48911 and is currently estimated at $110,531, approximately $132 per square foot. 3235 W Mount Hope Ave is a home located in Ingham County with nearby schools including Averill Elementary School, Attwood School, and J.W. Sexton High School.
Ownership History
Date
Name
Owned For
Owner Type
Purchase Details
Closed on
Mar 22, 2024
Sold by
Meraji Mazdak Ahmed
Bought by
Sshmidt Frank William
Current Estimated Value
Purchase Details
Closed on
Nov 21, 2023
Sold by
Abduljaber Mohamad H
Bought by
Meraji Mazdak Ahmed
Purchase Details
Closed on
Mar 6, 2023
Sold by
Brown Robert Lee
Bought by
Meraji Mazdak Ahmed
Purchase Details
Closed on
Sep 26, 2016
Sold by
Meraji Mazdak Ahmed
Bought by
Brown Robert Lee
Purchase Details
Closed on
May 6, 2015
Sold by
Abduljaber Mohamad H and Ihabatah Usama A
Bought by
Meraji Mazdak Ahmed
Home Financials for this Owner
Home Financials are based on the most recent Mortgage that was taken out on this home.
Original Mortgage
$16,500
Interest Rate
4.23%
Mortgage Type
New Conventional
Purchase Details
Closed on
Nov 18, 2005
Sold by
Phipps Sharon R
Bought by
Abdeljaber Mohamed
Create a Home Valuation Report for This Property
The Home Valuation Report is an in-depth analysis detailing your home's value as well as a comparison with similar homes in the area
Home Values in the Area
Average Home Value in this Area
Purchase History
| Date | Buyer | Sale Price | Title Company |
|---|---|---|---|
| Sshmidt Frank William | -- | None Listed On Document | |
| Meraji Mazdak Ahmed | $27,000 | None Listed On Document | |
| Meraji Mazdak Ahmed | -- | None Listed On Document | |
| Brown Robert Lee | $51,000 | None Available | |
| Meraji Mazdak Ahmed | $16,500 | None Available | |
| Abdeljaber Mohamed | $20,000 | Chicago Title Of Mi |
Source: Public Records
Mortgage History
| Date | Status | Borrower | Loan Amount |
|---|---|---|---|
| Previous Owner | Meraji Mazdak Ahmed | $16,500 | |
| Closed | Brown Robert Lee | $0 |
Source: Public Records
Tax History Compared to Growth
Tax History
| Year | Tax Paid | Tax Assessment Tax Assessment Total Assessment is a certain percentage of the fair market value that is determined by local assessors to be the total taxable value of land and additions on the property. | Land | Improvement |
|---|---|---|---|---|
| 2025 | $2,931 | $36,200 | $15,100 | $21,100 |
| 2024 | $23 | $52,300 | $15,100 | $37,200 |
| 2023 | $2,570 | $45,600 | $15,100 | $30,500 |
| 2022 | $2,347 | $37,900 | $11,100 | $26,800 |
| 2021 | $2,293 | $34,700 | $9,700 | $25,000 |
| 2020 | $2,277 | $31,700 | $9,700 | $22,000 |
| 2019 | $3,967 | $29,300 | $9,700 | $19,600 |
| 2018 | $2,086 | $26,200 | $9,700 | $16,500 |
| 2017 | $1,977 | $26,200 | $9,700 | $16,500 |
| 2016 | $3,159 | $25,800 | $9,700 | $16,100 |
| 2015 | $3,159 | $22,900 | $19,371 | $3,529 |
| 2014 | $3,159 | $22,400 | $19,371 | $3,029 |
Source: Public Records
Map
Nearby Homes
- 3310 W Mount Hope Ave
- 3333 Moores River Dr Unit 812
- 3508 Muirfield Dr
- 3601 Muirfield Dr
- 3421 Troon Cir Unit 29
- 3416 Cooley Dr
- 2201 Pamela Place
- 2200 Rossiter Place
- 3425 Cooley Dr
- 3614 Cooley Dr
- 2505 Hanover Dr
- 2418 Rossiter Place
- 2710 Bedford Rd
- 1533 Cambridge Rd
- 3510 Christine Dr
- 3811 Cooley Dr
- 3214 Gingersnap Ln
- 2838 Sunderland Rd
- 2905 S Catherine St
- 3600 Sandhurst Dr
- 3241 W Mount Hope Ave
- 3237 W Mount Hope Ave
- 3225 W Mount Hope Ave
- 3201 W Mount Hope Ave
- 3131 S Cambridge Rd
- 3201 S Cambridge Rd
- 3215 W Mount Hope Ave
- 3131 W Mount Hope Ave
- 3123 S Cambridge Rd
- 3313 W Mount Hope Ave
- 3121 W Mount Hope Ave
- 3105 S Cambridge Rd
- 3209 S Cambridge Rd
- 3206 S Cambridge Rd
- 3031 S Cambridge Rd
- 3118 S Cambridge Rd
- 3025 S Cambridge Rd
- 3215 S Cambridge Rd
- 3212 S Cambridge Rd
- 3407 W Mount Hope Ave