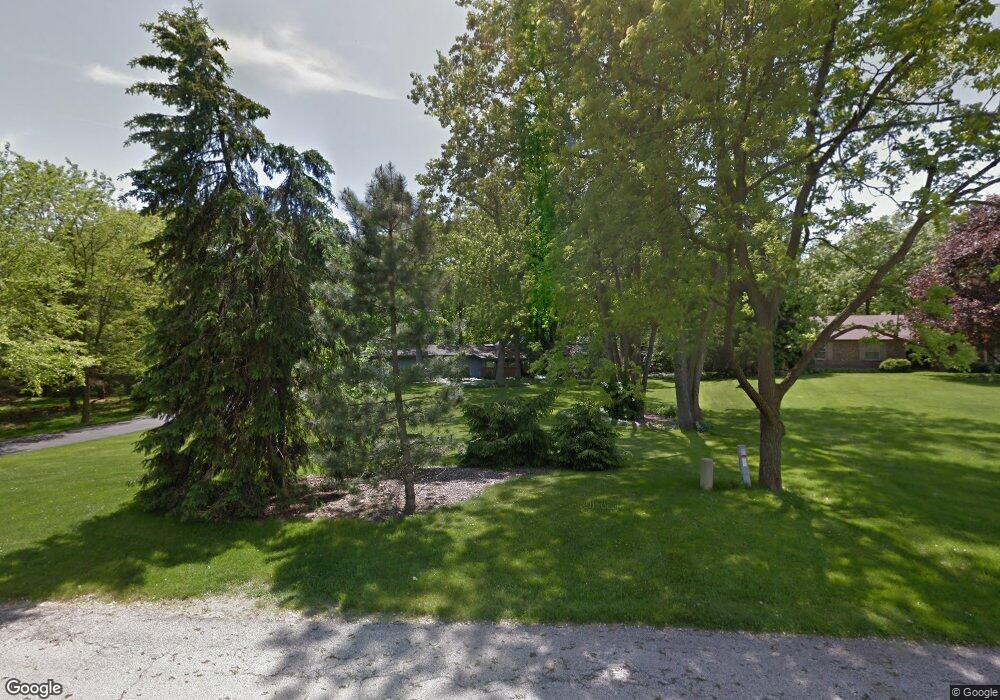
32353 N Forest Dr Grayslake, IL 60030
Estimated Value: $372,456 - $563,000
--
Bed
2
Baths
1,884
Sq Ft
$257/Sq Ft
Est. Value
About This Home
This home is located at 32353 N Forest Dr, Grayslake, IL 60030 and is currently estimated at $483,864, approximately $256 per square foot. 32353 N Forest Dr is a home located in Lake County with nearby schools including Woodland Primary School, Woodland Elementary School, and Woodland Intermediate School.
Ownership History
Date
Name
Owned For
Owner Type
Purchase Details
Closed on
May 10, 2024
Sold by
Edward Bingley Revocable Trust and Bingley Edward
Bought by
Cynthia M Bingley Revocable Trust and Bingley
Current Estimated Value
Purchase Details
Closed on
Mar 13, 2018
Sold by
Bingley Cynthia M and Cynthia M Bingley Revocable Tr
Bought by
Bingley Edward and Edward Bingley Revocable Trust
Purchase Details
Closed on
Jun 15, 2017
Sold by
Bingley Edward and Bingley Cynthia M
Bought by
Bingley Cynthia M and Cynthia M Bingley Revocable Tr
Purchase Details
Closed on
May 31, 2001
Sold by
Connolly Patrick J and Connolly Mauren M
Bought by
Bingley Edward J and Bingley Cynthia M
Home Financials for this Owner
Home Financials are based on the most recent Mortgage that was taken out on this home.
Original Mortgage
$275,000
Interest Rate
7.18%
Create a Home Valuation Report for This Property
The Home Valuation Report is an in-depth analysis detailing your home's value as well as a comparison with similar homes in the area
Home Values in the Area
Average Home Value in this Area
Purchase History
| Date | Buyer | Sale Price | Title Company |
|---|---|---|---|
| Cynthia M Bingley Revocable Trust | -- | None Listed On Document | |
| Bingley Edward | -- | None Available | |
| Bingley Cynthia M | -- | None Available | |
| Bingley Edward J | $375,000 | -- |
Source: Public Records
Mortgage History
| Date | Status | Borrower | Loan Amount |
|---|---|---|---|
| Previous Owner | Bingley Edward J | $275,000 |
Source: Public Records
Tax History Compared to Growth
Tax History
| Year | Tax Paid | Tax Assessment Tax Assessment Total Assessment is a certain percentage of the fair market value that is determined by local assessors to be the total taxable value of land and additions on the property. | Land | Improvement |
|---|---|---|---|---|
| 2024 | $7,714 | $99,174 | $30,515 | $68,659 |
| 2023 | $6,450 | $92,075 | $28,331 | $63,744 |
| 2022 | $6,450 | $88,785 | $35,127 | $53,658 |
| 2021 | $6,100 | $78,186 | $30,934 | $47,252 |
| 2020 | $6,069 | $76,265 | $30,174 | $46,091 |
| 2019 | $6,560 | $74,051 | $29,298 | $44,753 |
| 2018 | $6,285 | $74,658 | $28,766 | $45,892 |
| 2017 | $5,887 | $72,519 | $27,942 | $44,577 |
| 2016 | $5,822 | $69,290 | $26,698 | $42,592 |
| 2015 | $5,652 | $65,716 | $25,321 | $40,395 |
| 2014 | $7,223 | $82,160 | $25,024 | $57,136 |
| 2012 | $7,056 | $82,790 | $25,216 | $57,574 |
Source: Public Records
Map
Nearby Homes
- 32381 N Forest Dr
- 1544 Portia Rd
- 18256 W Il Route 120
- 33070 N Ridge Rd
- 18225 W Lindenwood Dr
- 33113 N Cove Rd
- 1617 Albany St
- 1544 Syracuse Dr
- 18740 W Willow Point Dr
- 33276 N Sunset Ave
- 977 Harris Rd Unit 34
- 33336 N Indian Ln
- 17914 W Twin Lakes Blvd
- 1191 Hummingbird Ln
- 18124 W Avon Ct
- 17602 W Knollwood Ct
- 1960 Pinehurst Ct
- 33448 N Greentree Rd
- 23 Bobolink Dr
- 33611 N Idlewild Dr
- 32329 N Forest Dr
- 32603 N Forest Dr
- 32639 N Forest Dr
- 32321 N Forest Dr
- 32575 N Forest Dr
- 32328 N Forest Dr
- 32433 N Forest Dr
- 32366 N Forest Dr
- 32675 N Forest Dr
- 32501 N Forest Dr
- 18661 W Brooke Ave
- 32394 N Forest Dr
- 18623 W Brooke Ave
- 18693 W Brooke Ave
- 18689 W Linden Ave
- 32715 N Forest Dr
- 32545 N Forest Dr
- 18581 W Brooke Ave
- 18553 W Brooke Ave
- 32418 N Forest Dr