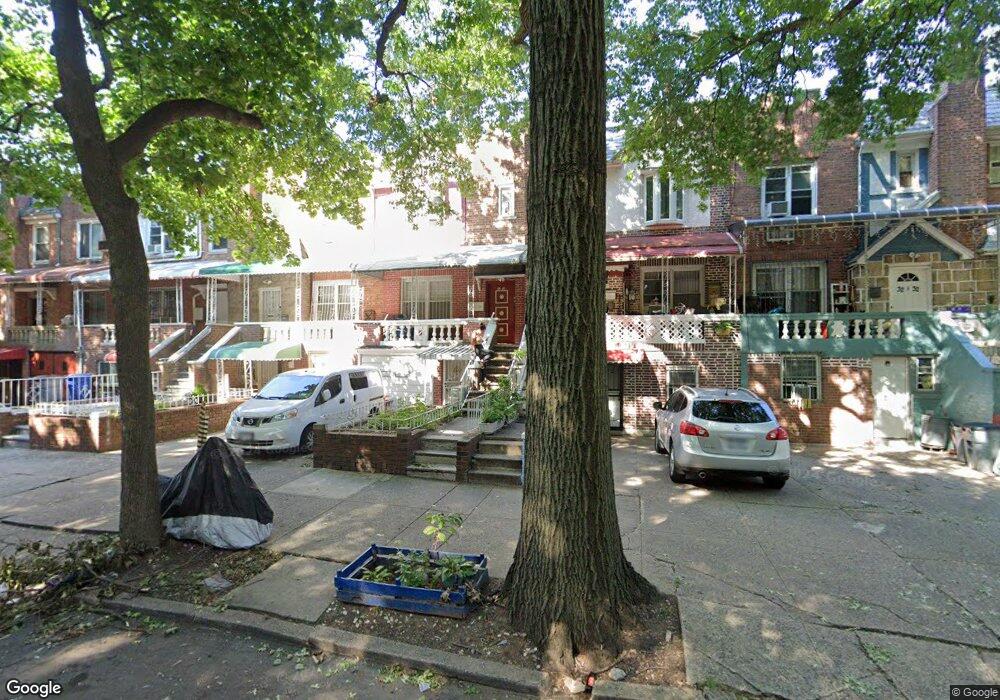
3236 88th St Unit 2 East Elmhurst, NY 11369
Jackson Heights NeighborhoodEstimated Value: $1,045,036 - $1,311,000
2
Beds
1
Bath
665
Sq Ft
$1,761/Sq Ft
Est. Value
About This Home
This home is located at 3236 88th St Unit 2, East Elmhurst, NY 11369 and is currently estimated at $1,171,009, approximately $1,760 per square foot. 3236 88th St Unit 2 is a home located in Queens County with nearby schools including P.S. 148, I.S. 145 Joseph Pulitzer Magnet School, and Newtown High School.
Ownership History
Date
Name
Owned For
Owner Type
Purchase Details
Closed on
Dec 20, 2023
Sold by
Eltaher Shazly M
Bought by
Chen Qiang
Current Estimated Value
Home Financials for this Owner
Home Financials are based on the most recent Mortgage that was taken out on this home.
Original Mortgage
$690,000
Outstanding Balance
$676,861
Interest Rate
7.29%
Mortgage Type
Purchase Money Mortgage
Estimated Equity
$494,148
Purchase Details
Closed on
Jan 17, 2013
Sold by
Kreymeyer John H
Bought by
Eltaher Shazly M
Home Financials for this Owner
Home Financials are based on the most recent Mortgage that was taken out on this home.
Original Mortgage
$308,700
Interest Rate
3.45%
Mortgage Type
New Conventional
Purchase Details
Closed on
Aug 30, 2006
Sold by
Kremeyer Maria
Bought by
Kremeyer John H and Kremeyer Maria
Create a Home Valuation Report for This Property
The Home Valuation Report is an in-depth analysis detailing your home's value as well as a comparison with similar homes in the area
Home Values in the Area
Average Home Value in this Area
Purchase History
| Date | Buyer | Sale Price | Title Company |
|---|---|---|---|
| Chen Qiang | $990,000 | -- | |
| Chen Qiang | $990,000 | -- | |
| Chen Qiang | $990,000 | -- | |
| Eltaher Shazly M | $498,000 | -- | |
| Eltaher Shazly M | $498,000 | -- | |
| Kremeyer John H | -- | -- | |
| Kremeyer John H | -- | -- |
Source: Public Records
Mortgage History
| Date | Status | Borrower | Loan Amount |
|---|---|---|---|
| Open | Chen Qiang | $690,000 | |
| Closed | Chen Qiang | $690,000 | |
| Previous Owner | Eltaher Shazly M | $308,700 |
Source: Public Records
Tax History Compared to Growth
Tax History
| Year | Tax Paid | Tax Assessment Tax Assessment Total Assessment is a certain percentage of the fair market value that is determined by local assessors to be the total taxable value of land and additions on the property. | Land | Improvement |
|---|---|---|---|---|
| 2025 | $9,135 | $45,827 | $6,794 | $39,033 |
| 2024 | $9,135 | $45,480 | $6,333 | $39,147 |
| 2023 | $7,855 | $42,907 | $5,861 | $37,046 |
| 2022 | $3,382 | $65,160 | $9,900 | $55,260 |
| 2021 | $7,378 | $54,000 | $9,900 | $44,100 |
| 2020 | $7,424 | $52,020 | $9,900 | $42,120 |
| 2019 | $7,269 | $56,460 | $9,900 | $46,560 |
| 2018 | $6,630 | $35,756 | $8,845 | $26,911 |
| 2017 | $6,230 | $33,733 | $8,258 | $25,475 |
| 2016 | $5,741 | $33,733 | $8,258 | $25,475 |
| 2015 | $1,480 | $31,824 | $9,563 | $22,261 |
| 2014 | $1,480 | $31,584 | $9,681 | $21,903 |
Source: Public Records
Map
Nearby Homes
- 32-25 88th St Unit 510
- 32-40 89th St Unit 611
- 32-40 89th St Unit C409
- 32-40 89th St Unit 110
- 32-42 89th St Unit C206
- 32-18 88th St
- 32-23 88th St Unit 306
- 32-23 88th St Unit 601
- 88-11 Northern Blvd Unit 110
- 88-09 Northern Blvd Unit 504
- 32-22 89th St Unit 204
- 88-10 32nd Ave Unit 106
- 88-10 32nd Ave Unit 201
- 32-45 90th St Unit 607
- 33-33 88th St
- 90-09 Northern Blvd Unit 605
- 90-09 Northern Blvd Unit 303
- 90-09 Northern Blvd Unit 302
- 32-23 90th St Unit 106
- 32-23 90th St Unit 103