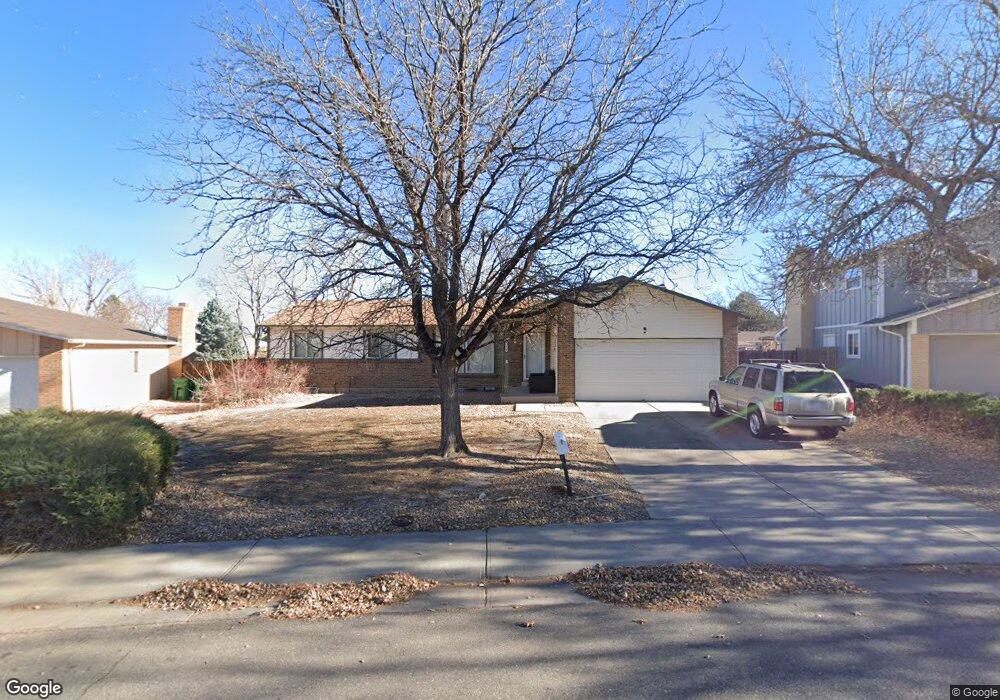
3236 S Nucla St Aurora, CO 80013
Meadowood NeighborhoodEstimated Value: $462,000 - $554,000
3
Beds
2
Baths
3,004
Sq Ft
$163/Sq Ft
Est. Value
About This Home
This home is located at 3236 S Nucla St, Aurora, CO 80013 and is currently estimated at $490,500, approximately $163 per square foot. 3236 S Nucla St is a home located in Arapahoe County with nearby schools including Dartmouth Elementary School, Columbia Middle School, and Rangeview High School.
Ownership History
Date
Name
Owned For
Owner Type
Purchase Details
Closed on
Mar 31, 2016
Sold by
Kenneth Nelson Trust
Bought by
Ho Dai and Nguyen Xuan T
Current Estimated Value
Home Financials for this Owner
Home Financials are based on the most recent Mortgage that was taken out on this home.
Original Mortgage
$228,000
Outstanding Balance
$179,471
Interest Rate
3.65%
Mortgage Type
New Conventional
Estimated Equity
$311,029
Purchase Details
Closed on
Jul 22, 2015
Sold by
Nelson Kenneth
Bought by
Kenneth Nelson Trust
Purchase Details
Closed on
Apr 12, 2004
Sold by
Ficke Judith A
Bought by
Nelson Kenneth
Purchase Details
Closed on
Jun 15, 1992
Sold by
Conversion Arapco
Bought by
Ficke Judith A
Purchase Details
Closed on
Jul 4, 1776
Bought by
Conversion Arapco
Create a Home Valuation Report for This Property
The Home Valuation Report is an in-depth analysis detailing your home's value as well as a comparison with similar homes in the area
Home Values in the Area
Average Home Value in this Area
Purchase History
| Date | Buyer | Sale Price | Title Company |
|---|---|---|---|
| Ho Dai | $285,000 | Fidelity National Title Ins | |
| Kenneth Nelson Trust | -- | None Available | |
| Nelson Kenneth | $200,000 | -- | |
| Ficke Judith A | -- | -- | |
| Conversion Arapco | -- | -- |
Source: Public Records
Mortgage History
| Date | Status | Borrower | Loan Amount |
|---|---|---|---|
| Open | Ho Dai | $228,000 |
Source: Public Records
Tax History
| Year | Tax Paid | Tax Assessment Tax Assessment Total Assessment is a certain percentage of the fair market value that is determined by local assessors to be the total taxable value of land and additions on the property. | Land | Improvement |
|---|---|---|---|---|
| 2025 | $3,172 | $30,194 | -- | -- |
| 2024 | $3,077 | $33,105 | -- | -- |
| 2023 | $3,077 | $33,105 | $0 | $0 |
| 2022 | $2,646 | $26,347 | $0 | $0 |
| 2021 | $2,731 | $26,347 | $0 | $0 |
| 2020 | $2,540 | $24,396 | $0 | $0 |
| 2019 | $2,527 | $24,396 | $0 | $0 |
| 2018 | $2,212 | $20,916 | $0 | $0 |
| 2017 | $1,924 | $20,916 | $0 | $0 |
| 2016 | $1,443 | $15,355 | $0 | $0 |
| 2015 | $1,392 | $15,355 | $0 | $0 |
| 2014 | $1,077 | $11,439 | $0 | $0 |
| 2013 | -- | $13,080 | $0 | $0 |
Source: Public Records
Map
Nearby Homes
- 3196 S Olathe Way
- 3138 S Mobile Way
- 16433 E Girard Ave
- 17409 E Flora Place
- 16180 E Flora Place
- 16464 E Bates Dr
- 3584 S Olathe Way
- 3581 S Olathe St
- 3577 S Ouray Cir
- 3569 S Nucla St
- 3362 S Sedalia Way
- 3564 S Pitkin Cir
- 3642 S Mobile Way
- 17620 E Bethany Dr
- 16743 E Kenyon Dr
- 16015 E Ithaca Place Unit E
- 3698 S Norfolk Way
- 17129 E Kenyon Place
- 16847 E Kent Dr
- 15855 E Cornell Place
- 3226 S Nucla St
- 3240 S Nucla St
- 3195 S Olathe Way
- 3175 S Olathe Way
- 3217 S Olathe Way
- 3216 S Nucla St
- 3165 S Olathe Way
- 3235 S Nucla St
- 3227 S Olathe Way
- 3206 S Nucla St
- 3215 S Nucla St
- 3237 S Olathe Way
- 3155 S Olathe Way
- 3255 S Nucla St
- 3247 S Olathe Way
- 3166 S Olathe Way
- 3242 S Norfolk Way
- 3205 S Nucla St
- 3266 S Nucla St
- 3232 S Norfolk Way
Your Personal Tour Guide
Ask me questions while you tour the home.