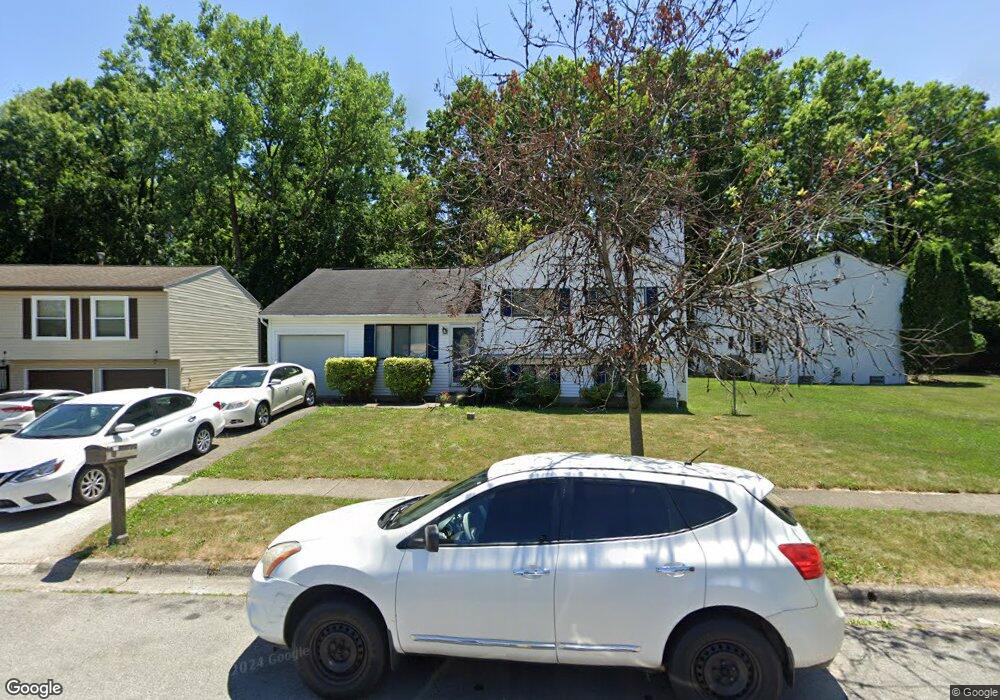
3239 Lone Spruce Rd Columbus, OH 43219
Cumberland Ridge NeighborhoodEstimated Value: $184,000 - $286,000
3
Beds
2
Baths
1,301
Sq Ft
$185/Sq Ft
Est. Value
About This Home
This home is located at 3239 Lone Spruce Rd, Columbus, OH 43219 and is currently estimated at $240,397, approximately $184 per square foot. 3239 Lone Spruce Rd is a home located in Franklin County with nearby schools including Cassady Elementary School, Mifflin Middle School, and Mifflin High School.
Ownership History
Date
Name
Owned For
Owner Type
Purchase Details
Closed on
Oct 28, 2010
Sold by
Wells Fargo Financial I Inc
Bought by
Smith Garrett and Smith Garrett K
Current Estimated Value
Home Financials for this Owner
Home Financials are based on the most recent Mortgage that was taken out on this home.
Original Mortgage
$61,610
Interest Rate
4.78%
Mortgage Type
FHA
Purchase Details
Closed on
Sep 8, 2010
Sold by
Miller Harry L and Miller Cheryl A
Bought by
Wells Fargo Financial Ohio 1 Inc
Home Financials for this Owner
Home Financials are based on the most recent Mortgage that was taken out on this home.
Original Mortgage
$61,610
Interest Rate
4.78%
Mortgage Type
FHA
Purchase Details
Closed on
May 12, 1992
Purchase Details
Closed on
Dec 26, 1991
Create a Home Valuation Report for This Property
The Home Valuation Report is an in-depth analysis detailing your home's value as well as a comparison with similar homes in the area
Home Values in the Area
Average Home Value in this Area
Purchase History
| Date | Buyer | Sale Price | Title Company |
|---|---|---|---|
| Smith Garrett | $65,000 | Attorney | |
| Wells Fargo Financial Ohio 1 Inc | $76,000 | None Available | |
| -- | $83,300 | -- | |
| -- | $9,000 | -- |
Source: Public Records
Mortgage History
| Date | Status | Borrower | Loan Amount |
|---|---|---|---|
| Previous Owner | Smith Garrett | $61,610 |
Source: Public Records
Tax History Compared to Growth
Tax History
| Year | Tax Paid | Tax Assessment Tax Assessment Total Assessment is a certain percentage of the fair market value that is determined by local assessors to be the total taxable value of land and additions on the property. | Land | Improvement |
|---|---|---|---|---|
| 2024 | $2,867 | $63,880 | $18,900 | $44,980 |
| 2023 | $2,830 | $63,875 | $18,900 | $44,975 |
| 2022 | $2,218 | $42,770 | $10,500 | $32,270 |
| 2021 | $2,222 | $42,770 | $10,500 | $32,270 |
| 2020 | $2,225 | $42,770 | $10,500 | $32,270 |
| 2019 | $2,304 | $37,980 | $10,500 | $27,480 |
| 2018 | $2,268 | $37,980 | $10,500 | $27,480 |
| 2017 | $2,384 | $37,980 | $10,500 | $27,480 |
| 2016 | $2,465 | $37,210 | $5,880 | $31,330 |
| 2015 | $2,238 | $37,210 | $5,880 | $31,330 |
| 2014 | $2,243 | $37,210 | $5,880 | $31,330 |
| 2013 | $1,165 | $39,165 | $6,195 | $32,970 |
Source: Public Records
Map
Nearby Homes
- 1929 Holly Ridge Rd
- 3096 Leon Ave
- 1822 Stelzer Rd
- 2876 Johnstown Rd
- 2736 Bellero Way Unit 94
- 2193 Rustic Ledge Dr
- 3601 Agler Rd
- 0 E Emmons Ave
- 2275 Stelzer Rd
- 3832 Emmons Ave
- 0 E Minnesota Ave Unit 224018641
- 0 Agler Rd Unit 224000625
- 3784 Armuth Ave
- 3221 Caralee Dr
- 2457 Ashpoint St
- 2423 Stelzer Rd
- 2483 Vendome Dr
- 3888 Agler Rd
- 2398 Dunkirk Dr
- 2424 Holt Ave
- 3247 Lone Spruce Rd
- 1790 Mountain Oak Rd
- 3255 Lone Spruce Rd
- 3244 Lone Spruce Rd
- 3263 Lone Spruce Rd
- 3254 Lone Spruce Rd
- 1803 Mountain Oak Rd
- 1795 Mountain Oak Rd
- 1818 Mountain Oak Rd
- 3262 Lone Spruce Rd
- 3271 Lone Spruce Rd
- 1809 Mountain Oak Rd
- 0 Drake Rd
- 3270 Lone Spruce Rd
- 1828 Mountain Oak Rd
- 1824 Passage Ln
- 3279 Lone Spruce Rd
- 3223 Larch Ln
- 3278 Lone Spruce Rd
- 1833 Ferntree Rd