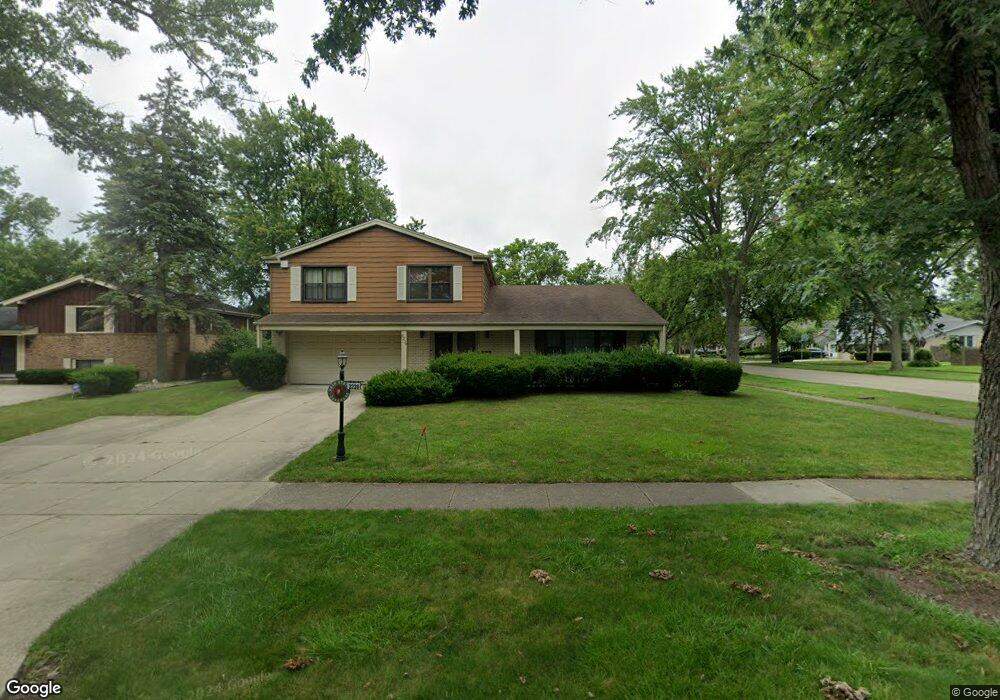
3239 Maple Leaf Dr Unit 1 Glenview, IL 60026
The Willows NeighborhoodEstimated Value: $717,404 - $905,000
4
Beds
3
Baths
2,300
Sq Ft
$347/Sq Ft
Est. Value
About This Home
This home is located at 3239 Maple Leaf Dr Unit 1, Glenview, IL 60026 and is currently estimated at $798,851, approximately $347 per square foot. 3239 Maple Leaf Dr Unit 1 is a home located in Cook County with nearby schools including Willowbrook Elementary School, Maple School, and Glenbrook South High School.
Ownership History
Date
Name
Owned For
Owner Type
Purchase Details
Closed on
Aug 13, 2015
Sold by
Goldwin Robert A and Goldwin Frannie E
Bought by
Goldwin Family Living Trust
Current Estimated Value
Purchase Details
Closed on
Sep 8, 2011
Sold by
Geitner Helene
Bought by
Goldwin Robert A and Goldwin Frannie
Home Financials for this Owner
Home Financials are based on the most recent Mortgage that was taken out on this home.
Original Mortgage
$345,600
Outstanding Balance
$232,696
Interest Rate
4.14%
Mortgage Type
New Conventional
Estimated Equity
$566,155
Purchase Details
Closed on
May 10, 2010
Sold by
Geitner Stephanie
Bought by
Geitner Helene and Helene Geitner Estate Trust
Purchase Details
Closed on
Oct 31, 2008
Sold by
Geitner Helene
Bought by
Geitner Stephanie
Purchase Details
Closed on
May 4, 2000
Sold by
Geitner Sherwin and Geitner Helene
Bought by
Geitner Helene and The Helene Geitner Estate Trust
Create a Home Valuation Report for This Property
The Home Valuation Report is an in-depth analysis detailing your home's value as well as a comparison with similar homes in the area
Home Values in the Area
Average Home Value in this Area
Purchase History
| Date | Buyer | Sale Price | Title Company |
|---|---|---|---|
| Goldwin Family Living Trust | -- | Attorney | |
| Goldwin Robert A | $432,000 | None Available | |
| Geitner Helene | -- | None Available | |
| Geitner Stephanie | -- | None Available | |
| Geitner Helene | -- | -- |
Source: Public Records
Mortgage History
| Date | Status | Borrower | Loan Amount |
|---|---|---|---|
| Open | Goldwin Robert A | $345,600 |
Source: Public Records
Tax History
| Year | Tax Paid | Tax Assessment Tax Assessment Total Assessment is a certain percentage of the fair market value that is determined by local assessors to be the total taxable value of land and additions on the property. | Land | Improvement |
|---|---|---|---|---|
| 2025 | $12,436 | $63,000 | $19,930 | $43,070 |
| 2024 | $12,436 | $57,000 | $16,911 | $40,089 |
| 2023 | $12,874 | $57,000 | $16,911 | $40,089 |
| 2022 | $12,874 | $57,000 | $16,911 | $40,089 |
| 2021 | $10,678 | $41,729 | $14,192 | $27,537 |
| 2020 | $10,533 | $41,729 | $14,192 | $27,537 |
| 2019 | $10,104 | $45,856 | $14,192 | $31,664 |
| 2018 | $10,854 | $44,855 | $12,380 | $32,475 |
| 2017 | $10,637 | $44,855 | $12,380 | $32,475 |
| 2016 | $10,462 | $48,516 | $12,380 | $36,136 |
| 2015 | $9,894 | $41,075 | $9,965 | $31,110 |
| 2014 | $9,713 | $41,075 | $9,965 | $31,110 |
| 2013 | $9,585 | $41,075 | $9,965 | $31,110 |
Source: Public Records
Map
Nearby Homes
- 2431 Cobblewood Dr Unit 9
- 2571 Essex Dr
- 2137 Dauntless Dr
- 102 Yale Ct Unit 34LH10
- 3820 Kiess Dr
- 3800 Kiess Dr
- 2050 Valencia Dr Unit 300C
- 2050 Valencia Dr Unit 405C
- 2230 Goldenrod Ln
- 3005 Highland Rd
- 1615 Greenwood Rd
- 1605 Elmdale Ave
- 3190 Landwehr Rd
- 3246 Landwehr Rd Unit 3
- 3240 Brookdale Ln
- 1867 Admiral Ct Unit 91
- 2408 Violet St
- 2803 Wildflower Ct
- 3256 Westview Dr
- 3849 Grace Ln
- 3235 Maple Leaf Dr
- 3231 Maple Leaf Dr
- 3311 Maple Leaf Dr
- 2419 Greenwood Rd Unit 1
- 2345 Greenwood Rd
- 2350 Greenwood Rd
- 2340 Phillips Dr
- 3227 Maple Leaf Dr
- 3232 Maple Leaf Dr Unit 3
- 3306 Maple Leaf Dr
- 2337 Greenwood Rd
- 2423 Greenwood Rd
- 2344 Greenwood Rd
- 3317 Maple Leaf Dr
- 2334 Phillips Dr
- 3232 Brandess Dr
- 3230 Maple Leaf Dr
- 3223 Maple Leaf Dr
- 3312 Maple Leaf Dr
- 2336 Greenwood Rd
Your Personal Tour Guide
Ask me questions while you tour the home.